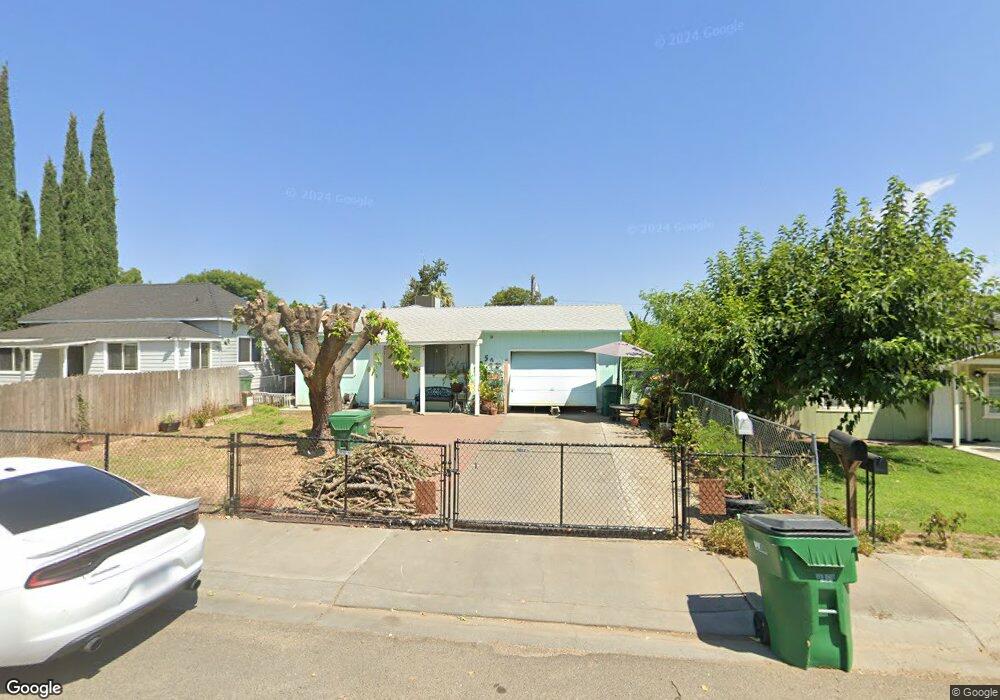
508 Almond St Corning, CA 96021
Estimated Value: $184,000 - $313,000
Studio
--
Bath
--
Sq Ft
6,970
Sq Ft Lot
About This Home
This home is located at 508 Almond St, Corning, CA 96021 and is currently estimated at $248,164. 508 Almond St is a home located in Tehama County with nearby schools including Olive View Elementary School, Maywood Middle School, and Corning High School.
Ownership History
Date
Name
Owned For
Owner Type
Purchase Details
Closed on
Sep 3, 2020
Sold by
Soria Maria and Leal Maria
Bought by
Soria Maria
Current Estimated Value
Purchase Details
Closed on
Jun 22, 2020
Sold by
Leal Roberto
Bought by
Soria Maria and Leal Maria
Purchase Details
Closed on
Jul 26, 2001
Sold by
Wright Louise E
Bought by
Leal Roberto and Leal Maria
Home Financials for this Owner
Home Financials are based on the most recent Mortgage that was taken out on this home.
Original Mortgage
$62,930
Interest Rate
6.64%
Mortgage Type
FHA
Create a Home Valuation Report for This Property
The Home Valuation Report is an in-depth analysis detailing your home's value as well as a comparison with similar homes in the area
Purchase History
| Date | Buyer | Sale Price | Title Company |
|---|---|---|---|
| Soria Maria | -- | Soria Maria | |
| Soria Maria | -- | None Available | |
| Leal Roberto | $69,000 | -- |
Source: Public Records
Mortgage History
| Date | Status | Borrower | Loan Amount |
|---|---|---|---|
| Previous Owner | Leal Roberto | $62,930 |
Source: Public Records
Tax History
| Year | Tax Paid | Tax Assessment Tax Assessment Total Assessment is a certain percentage of the fair market value that is determined by local assessors to be the total taxable value of land and additions on the property. | Land | Improvement |
|---|---|---|---|---|
| 2025 | $965 | $100,265 | $29,059 | $71,206 |
| 2023 | $945 | $96,374 | $27,932 | $68,442 |
| 2022 | $931 | $94,485 | $27,385 | $67,100 |
| 2021 | $894 | $92,634 | $26,849 | $65,785 |
| 2020 | $903 | $91,685 | $26,574 | $65,111 |
| 2019 | $865 | $89,888 | $26,053 | $63,835 |
| 2018 | $865 | $88,127 | $25,543 | $62,584 |
| 2017 | $825 | $83,318 | $24,150 | $59,168 |
| 2016 | $744 | $79,350 | $23,000 | $56,350 |
| 2015 | $751 | $79,350 | $23,000 | $56,350 |
| 2014 | $646 | $69,000 | $20,000 | $49,000 |
Source: Public Records
Map
Nearby Homes
Your Personal Tour Guide
Ask me questions while you tour the home.