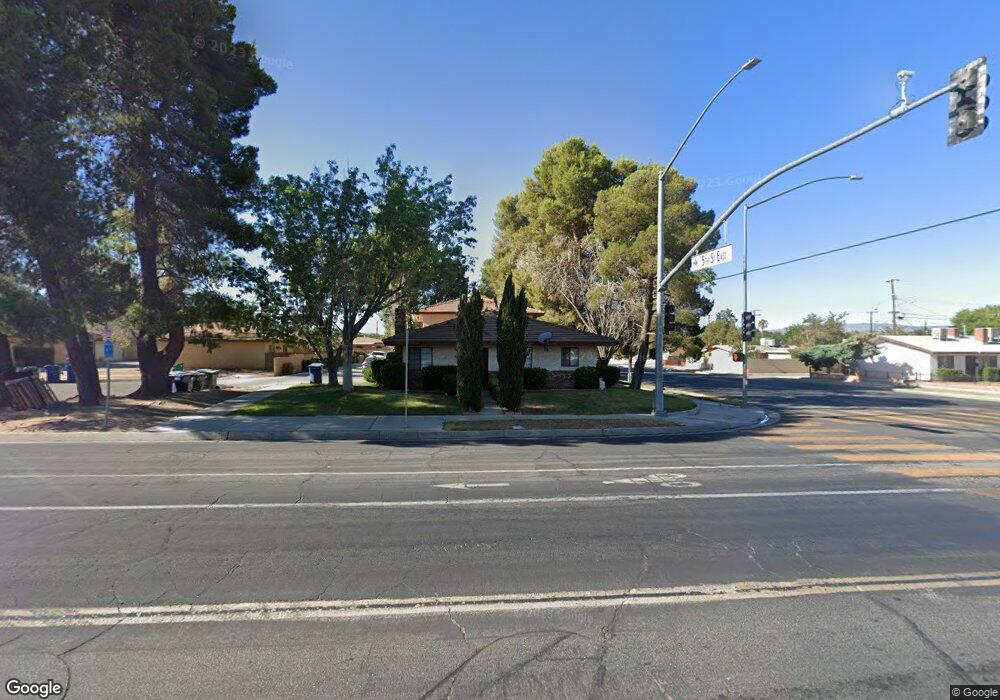
508 E Lancaster Blvd Unit B Lancaster, CA 93535
East Lancaster NeighborhoodEstimated Value: $71,000 - $932,000
2
Beds
2
Baths
3,962
Sq Ft
$169/Sq Ft
Est. Value
About This Home
This home is located at 508 E Lancaster Blvd Unit B, Lancaster, CA 93535 and is currently estimated at $668,388, approximately $168 per square foot. 508 E Lancaster Blvd Unit B is a home located in Los Angeles County with nearby schools including El Dorado Elementary School, Piute Middle School, and Antelope Valley High School.
Ownership History
Date
Name
Owned For
Owner Type
Purchase Details
Closed on
Jul 15, 2012
Sold by
Henrickson Thomas E and Alcala Henrickson Vivian T
Bought by
Patanyan Nerses
Current Estimated Value
Home Financials for this Owner
Home Financials are based on the most recent Mortgage that was taken out on this home.
Original Mortgage
$274,928
Outstanding Balance
$190,496
Interest Rate
3.75%
Mortgage Type
FHA
Estimated Equity
$477,892
Purchase Details
Closed on
Feb 18, 2009
Sold by
Henrickson Thomas E
Bought by
Henrickson Thomas E and Alcala Henrickson Vivian T
Purchase Details
Closed on
Dec 30, 1997
Sold by
Trust Sparks Florence J Tr Florence J Sp
Bought by
Henrickson Thomas
Purchase Details
Closed on
Dec 20, 1994
Sold by
Sparks Florence J
Bought by
Sparks Florence J and Florence J Sparks Revocable Tr
Create a Home Valuation Report for This Property
The Home Valuation Report is an in-depth analysis detailing your home's value as well as a comparison with similar homes in the area
Home Values in the Area
Average Home Value in this Area
Purchase History
| Date | Buyer | Sale Price | Title Company |
|---|---|---|---|
| Patanyan Nerses | $335,000 | Priority Title | |
| Henrickson Thomas E | -- | None Available | |
| Henrickson Thomas | -- | Lawyers Title Company | |
| Sparks Florence J | -- | -- |
Source: Public Records
Mortgage History
| Date | Status | Borrower | Loan Amount |
|---|---|---|---|
| Open | Patanyan Nerses | $274,928 |
Source: Public Records
Tax History
| Year | Tax Paid | Tax Assessment Tax Assessment Total Assessment is a certain percentage of the fair market value that is determined by local assessors to be the total taxable value of land and additions on the property. | Land | Improvement |
|---|---|---|---|---|
| 2025 | $7,262 | $412,518 | $61,567 | $350,951 |
| 2024 | $7,262 | $404,430 | $60,360 | $344,070 |
| 2023 | $7,130 | $396,501 | $59,177 | $337,324 |
| 2022 | $7,004 | $388,727 | $58,017 | $330,710 |
| 2021 | $6,876 | $381,106 | $56,880 | $324,226 |
| 2019 | $6,692 | $369,804 | $55,194 | $314,610 |
| 2018 | $6,579 | $362,554 | $54,112 | $308,442 |
| 2016 | $6,243 | $348,477 | $52,011 | $296,466 |
| 2015 | $6,168 | $343,243 | $51,230 | $292,013 |
| 2014 | $6,074 | $336,520 | $50,227 | $286,293 |
Source: Public Records
Map
Nearby Homes
- 467 E Lingard St
- 520 E Norberry St
- 44715 Gingham Ave
- 546 E Nugent St
- 44727 Andale Ave
- 44703 Andale Ave
- 44655 4th St E
- 44853 5th St E
- 423 Landsford St
- 44739 3rd St E
- 44745 3rd St E
- 359 Langhorn St
- 44504 Watford Ave
- 416 E Kildare St
- 523 E Kettering St
- 356 E Kettering St
- 44714 2nd St E
- 44422 Sancroft Ave
- 333 E Kildare St
- 44512 N Tabler Ave
- 508 E Lancaster Blvd
- 516 E Lancaster Blvd
- 522 E Lancaster Blvd
- 503 E Lingard St
- 44737 5th St E
- 509 E Lingard St
- 528 E Lancaster Blvd
- 515 E Lingard St
- 534 E Lancaster Blvd Unit B
- 534 E Lancaster Blvd Unit A
- 534 E Lancaster Blvd
- 527 E Lingard St
- 470 E Lingard St
- 459 E Lingard St
- 558 E Lancaster Blvd Unit J-9
- 495 E Lancaster Blvd
- E Lingard St
- 531 E Lingard St
- 512 E Lingard St
Your Personal Tour Guide
Ask me questions while you tour the home.