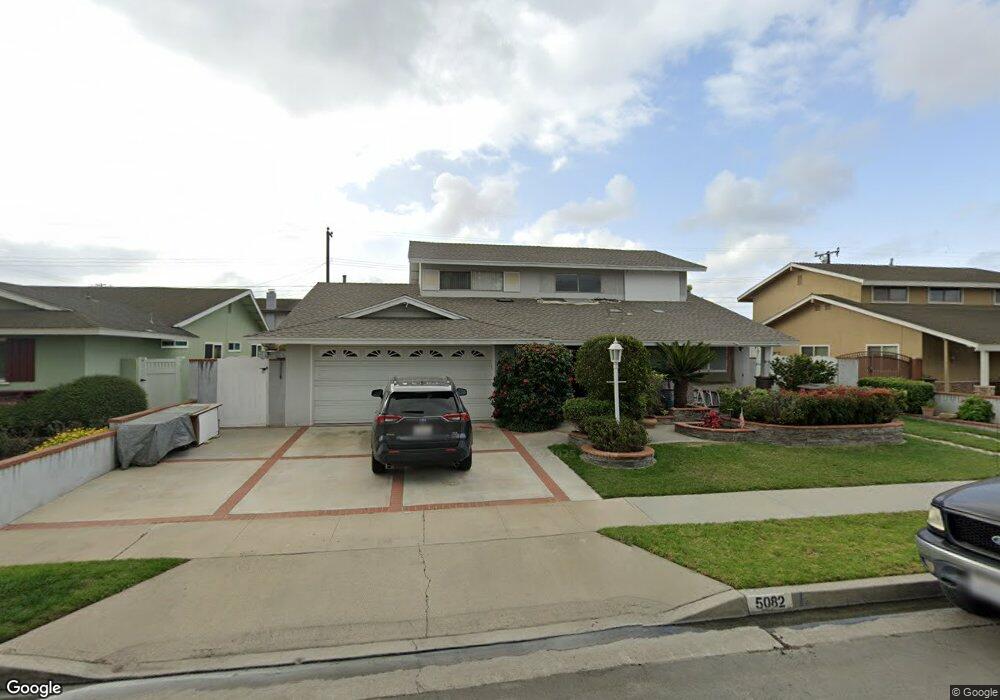
5082 Berkeley Ave Westminster, CA 92683
Estimated Value: $1,128,000 - $1,447,000
4
Beds
3
Baths
2,244
Sq Ft
$562/Sq Ft
Est. Value
About This Home
This home is located at 5082 Berkeley Ave, Westminster, CA 92683 and is currently estimated at $1,262,143, approximately $562 per square foot. 5082 Berkeley Ave is a home located in Orange County with nearby schools including Eastwood Elementary School, Helen Stacey Intermediate School, and Westminster High School.
Ownership History
Date
Name
Owned For
Owner Type
Purchase Details
Closed on
Jun 13, 2018
Sold by
Shaw Floyd Randolph and Shaw Teresa Marie
Bought by
Shaw Floyd Randoph and Shaw Teresa Marie
Current Estimated Value
Purchase Details
Closed on
Dec 17, 1998
Sold by
Shaw Teresa M and Pagano Teresa M
Bought by
Shaw Floyd R and Shaw Teresa M
Home Financials for this Owner
Home Financials are based on the most recent Mortgage that was taken out on this home.
Original Mortgage
$185,600
Outstanding Balance
$42,632
Interest Rate
6.91%
Estimated Equity
$1,219,511
Purchase Details
Closed on
Sep 17, 1996
Sold by
Johnson Alfred O
Bought by
Pagano Teresa M and Shaw Floyd R
Home Financials for this Owner
Home Financials are based on the most recent Mortgage that was taken out on this home.
Original Mortgage
$188,800
Interest Rate
8.11%
Purchase Details
Closed on
Apr 22, 1996
Sold by
Johnson Alfred O and Johnson Dawnell
Bought by
Johnson Alfred O and Johnson Dawnell H
Create a Home Valuation Report for This Property
The Home Valuation Report is an in-depth analysis detailing your home's value as well as a comparison with similar homes in the area
Home Values in the Area
Average Home Value in this Area
Purchase History
| Date | Buyer | Sale Price | Title Company |
|---|---|---|---|
| Shaw Floyd Randoph | -- | None Available | |
| Shaw Floyd R | -- | Southland Title Corporation | |
| Pagano Teresa M | $236,000 | Continental Lawyers Title Co | |
| Johnson Alfred O | -- | -- |
Source: Public Records
Mortgage History
| Date | Status | Borrower | Loan Amount |
|---|---|---|---|
| Open | Shaw Floyd R | $185,600 | |
| Closed | Pagano Teresa M | $188,800 |
Source: Public Records
Tax History
| Year | Tax Paid | Tax Assessment Tax Assessment Total Assessment is a certain percentage of the fair market value that is determined by local assessors to be the total taxable value of land and additions on the property. | Land | Improvement |
|---|---|---|---|---|
| 2025 | $5,051 | $406,710 | $251,200 | $155,510 |
| 2024 | $5,051 | $398,736 | $246,275 | $152,461 |
| 2023 | $4,879 | $390,918 | $241,446 | $149,472 |
| 2022 | $4,800 | $383,253 | $236,711 | $146,542 |
| 2021 | $4,679 | $375,739 | $232,070 | $143,669 |
| 2020 | $4,625 | $371,887 | $229,691 | $142,196 |
| 2019 | $4,574 | $364,596 | $225,188 | $139,408 |
| 2018 | $4,572 | $357,448 | $220,773 | $136,675 |
| 2017 | $4,405 | $350,440 | $216,444 | $133,996 |
| 2016 | $4,271 | $343,569 | $212,200 | $131,369 |
| 2015 | $4,179 | $336,556 | $209,013 | $127,543 |
| 2014 | $3,937 | $316,006 | $204,919 | $111,087 |
Source: Public Records
Map
Nearby Homes
- 5011 Cambridge Ave
- 13731 Claremont St
- 5302 Clark Cir
- 5352 Duncannon Ave
- 14135 Elystan Cir
- 5602 Placer Ave
- 5566 Aldershot Walk
- 5021 Vauxhall Rd
- 14241 Blackpool Rd
- 5246 Saint George Rd
- 13972 Chelmsford Walk
- 14322 Suffolk St
- 14342 Suffolk St
- 5701 Norma Dr
- 5321 Victoria Place
- 3580 Teaberry Cir
- 3661 Wisteria St
- 5770 Centerstone Ct
- 5595 Tiffany Ave
- 5532 Tiffany Ave
- 5092 Berkeley Ave
- 5062 Berkeley Ave
- 5081 Dartmouth Ave
- 5061 Dartmouth Ave
- 5091 Dartmouth Ave
- 5052 Berkeley Ave
- 5112 Berkeley Ave
- 5081 Berkeley Ave
- 5051 Dartmouth Ave
- 5111 Dartmouth Ave
- 5091 Berkeley Ave
- 5061 Berkeley Ave
- 5042 Berkeley Ave
- 5051 Berkeley Ave
- 5111 Berkeley Ave
- 5041 Dartmouth Ave
- 5082 Dartmouth Ave
- 5041 Berkeley Ave
- 5082 Princeton Ave
- 5072 Dartmouth Ave
Your Personal Tour Guide
Ask me questions while you tour the home.