509 Hammon Ct Patterson, CA 95363
Patterson AreaEstimated Value: $424,000 - $453,922
About This Home
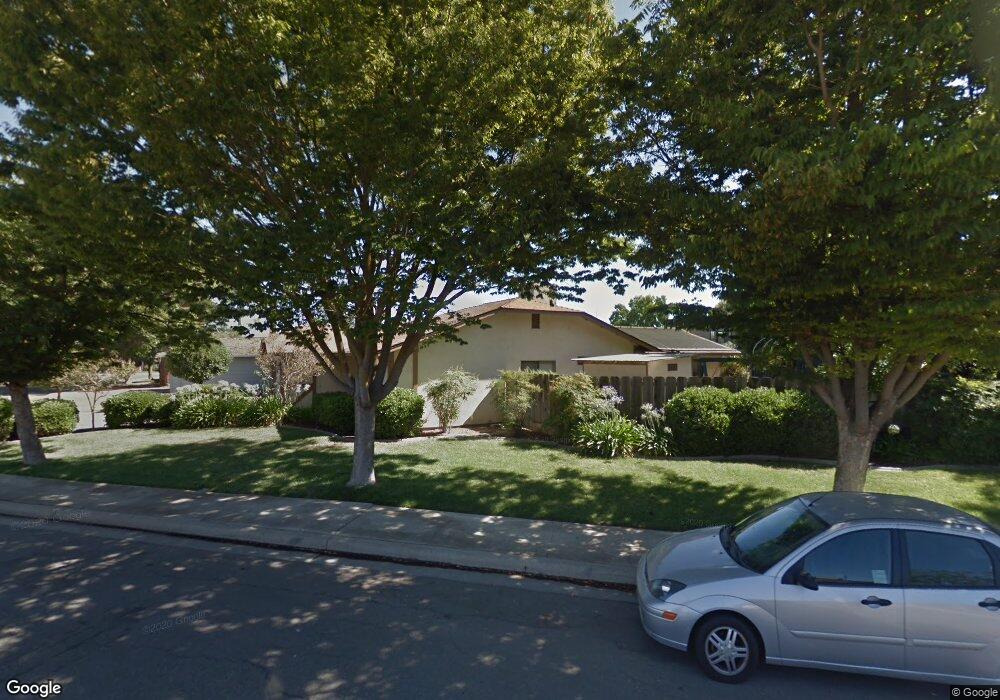
This home is located at 509 Hammon Ct, Patterson, CA 95363 and is currently estimated at $436,231, approximately $294 per square foot. 509 Hammon Ct is a home located in Stanislaus County with nearby schools including Northmead Elementary School, Creekside Middle School, and Patterson High School.
Ownership History
We collect this data history from publicly available records. To have your information removed, we recommend requesting removal directly through your county’s website.
Purchase Details
Purchase Details
Home Values in the Area
Average Home Value in this Area
Purchase History
We collect this data history from publicly available records. To have your information removed, we recommend requesting removal directly through your county’s website.
| Date | Buyer | Sale Price | Title Company |
|---|---|---|---|
| -- | None Available | ||
| -- | None Available | ||
| $111,000 | Stewart Title |
Mortgage History
We collect this data history from publicly available records. To have your information removed, we recommend requesting removal directly through your county’s website.
| Date | Status | Borrower | Loan Amount |
|---|---|---|---|
| Closed | $35,000 | ||
| Closed | $99,750 | ||
| Closed | $100,050 | ||
| Closed | $82,500 |
Tax History
We collect this data history from publicly available records. To have your information removed, we recommend requesting removal directly through your county’s website.
| Year | Tax Paid | Tax Assessment Tax Assessment Total Assessment is a certain percentage of the fair market value that is determined by local assessors to be the total taxable value of land and additions on the property. | Land | Improvement |
|---|---|---|---|---|
| 2025 | $2,069 | $184,381 | $49,828 | $134,553 |
| 2024 | $2,312 | $202,201 | $48,851 | $153,350 |
| 2023 | $2,258 | $198,238 | $47,894 | $150,344 |
| 2022 | $2,140 | $194,352 | $46,955 | $147,397 |
| 2021 | $2,109 | $190,542 | $46,035 | $144,507 |
| 2020 | $2,096 | $188,589 | $45,563 | $143,026 |
| 2019 | $2,063 | $184,892 | $44,670 | $140,222 |
| 2018 | $1,961 | $181,268 | $43,795 | $137,473 |
| 2017 | $1,918 | $177,715 | $42,937 | $134,778 |
| 2016 | $1,865 | $174,232 | $42,096 | $132,136 |
| 2015 | $1,837 | $171,616 | $41,464 | $130,152 |
| 2014 | $1,741 | $163,500 | $25,000 | $138,500 |
Map
- 534 Lola Ln
- 324 Barros St
- 408 Peregrine Dr
- 414 Vicki Lynn Ln
- 1314 Sutter Creek Ct
- 1212 Shearwater Dr
- 945 Arambel Dr
- 720 N 2nd St
- 140 Ivy Ave Unit A5
- 230 N 3rd St
- 1369 Buckskin Way
- 1434 Jake Creek Dr
- 701 Beck Creek Ln
- 1444 Mendocino Creek Dr
- 10037 California 33
- 1126 Gardenia Ct
- 855 Toyon Ln
- 505 Tuscany Ct
- 1438 Toggenberg St
- 1418 Longhorn Ln
Ask me questions while you tour the home.