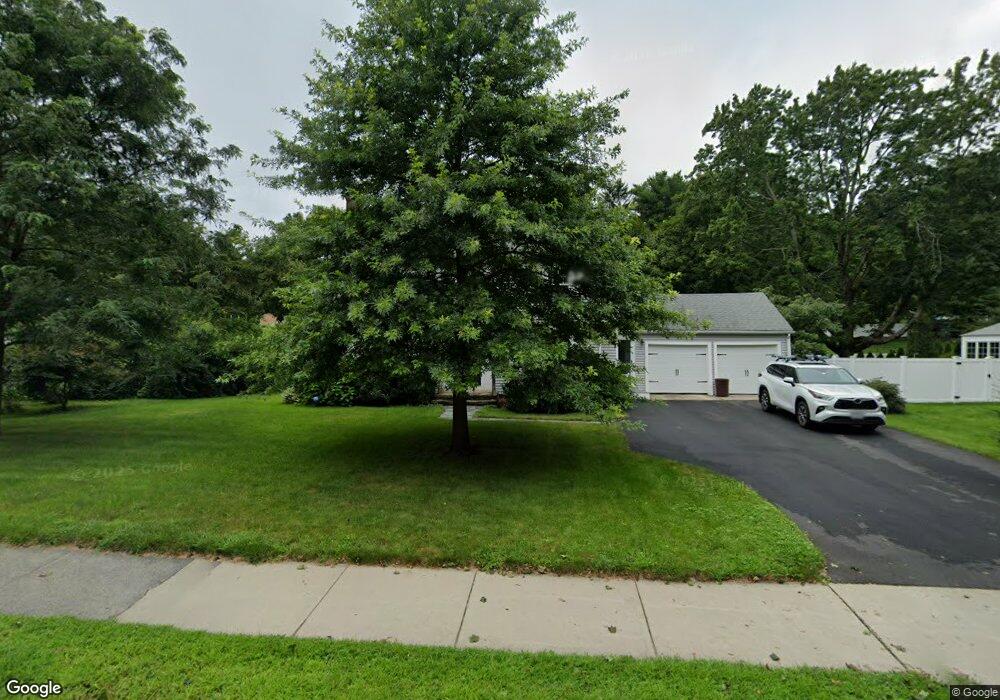
51 Forest St Worcester, MA 01609
Forest Grove NeighborhoodEstimated Value: $574,576 - $669,000
3
Beds
3
Baths
2,413
Sq Ft
$253/Sq Ft
Est. Value
About This Home
This home is located at 51 Forest St, Worcester, MA 01609 and is currently estimated at $610,644, approximately $253 per square foot. 51 Forest St is a home located in Worcester County with nearby schools including Nelson Place Elementary School, Jacob Hiatt Magnet School, and Chandler Magnet.
Ownership History
Date
Name
Owned For
Owner Type
Purchase Details
Closed on
Apr 28, 2011
Sold by
Polsky Nancy M and Polsky Colin D
Bought by
Mcshea Brain J and Mcshea Nancy E
Current Estimated Value
Home Financials for this Owner
Home Financials are based on the most recent Mortgage that was taken out on this home.
Original Mortgage
$263,150
Outstanding Balance
$181,863
Interest Rate
4.76%
Mortgage Type
Purchase Money Mortgage
Estimated Equity
$428,781
Purchase Details
Closed on
Jul 30, 2003
Sold by
Hamel James R and Hamel Pauline R
Bought by
Polsky Colin D and Polsky Nancy M
Home Financials for this Owner
Home Financials are based on the most recent Mortgage that was taken out on this home.
Original Mortgage
$244,000
Interest Rate
5.28%
Mortgage Type
Purchase Money Mortgage
Create a Home Valuation Report for This Property
The Home Valuation Report is an in-depth analysis detailing your home's value as well as a comparison with similar homes in the area
Home Values in the Area
Average Home Value in this Area
Purchase History
| Date | Buyer | Sale Price | Title Company |
|---|---|---|---|
| Mcshea Brain J | $277,000 | -- | |
| Polsky Colin D | $305,000 | -- |
Source: Public Records
Mortgage History
| Date | Status | Borrower | Loan Amount |
|---|---|---|---|
| Open | Mcshea Brain J | $263,150 | |
| Previous Owner | Polsky Colin D | $244,000 |
Source: Public Records
Tax History
| Year | Tax Paid | Tax Assessment Tax Assessment Total Assessment is a certain percentage of the fair market value that is determined by local assessors to be the total taxable value of land and additions on the property. | Land | Improvement |
|---|---|---|---|---|
| 2025 | $6,099 | $462,400 | $123,600 | $338,800 |
| 2024 | $5,970 | $434,200 | $123,600 | $310,600 |
| 2023 | $5,726 | $399,300 | $106,400 | $292,900 |
| 2022 | $5,296 | $348,200 | $85,200 | $263,000 |
| 2021 | $5,161 | $317,000 | $68,200 | $248,800 |
| 2020 | $4,995 | $293,800 | $68,000 | $225,800 |
| 2019 | $5,072 | $281,800 | $65,600 | $216,200 |
| 2018 | $5,040 | $266,500 | $65,600 | $200,900 |
| 2017 | $4,843 | $252,000 | $65,600 | $186,400 |
| 2016 | $4,944 | $239,900 | $53,900 | $186,000 |
| 2015 | $4,815 | $239,900 | $53,900 | $186,000 |
| 2014 | $4,668 | $238,900 | $53,900 | $185,000 |
Source: Public Records
Map
Nearby Homes
- 40 Westwood Dr
- 8 Old Colony Rd
- 49 Metcalf St
- 59 Beechmont St
- 14 Balder Rd
- 6 Roald St
- 6 Paul Revere Rd
- 577 Grove St
- 3 Westwood Dr
- 10 Dryden St Unit 7
- 493 Salisbury St
- 93 Newton Ave N
- 9 Dennison Rd
- 83 Newton Ave N
- 20B Edgeworth St
- 11 Holden St
- 15 Boardman St
- 31 Boardman St
- 7 Longworth Rd
- 44 Boardman St
Your Personal Tour Guide
Ask me questions while you tour the home.