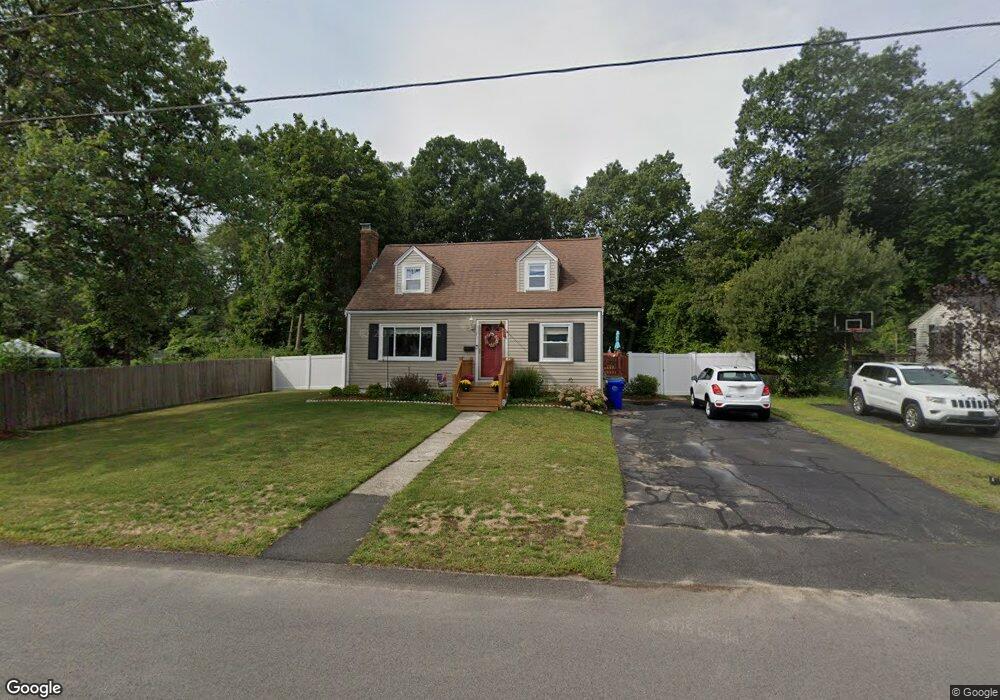
51 Moncrief Rd Rockland, MA 02370
Estimated Value: $485,000 - $555,000
3
Beds
1
Bath
999
Sq Ft
$526/Sq Ft
Est. Value
About This Home
This home is located at 51 Moncrief Rd, Rockland, MA 02370 and is currently estimated at $525,868, approximately $526 per square foot. 51 Moncrief Rd is a home located in Plymouth County with nearby schools including Rockland Senior High School, Calvary Chapel Academy, and Holy Family Elementary School.
Ownership History
Date
Name
Owned For
Owner Type
Purchase Details
Closed on
Sep 25, 1998
Sold by
Tillotson D David and Tillotson Tammy M
Bought by
Keane Stephen D and Keane Theresa A
Current Estimated Value
Purchase Details
Closed on
Mar 5, 1997
Sold by
Snow Kenneth and Snow Cindy
Bought by
Tillotson D David and Tilltoson Tammy M
Purchase Details
Closed on
Sep 27, 1990
Sold by
Chapman Michael J
Bought by
Keane Stephen D
Purchase Details
Closed on
Jun 24, 1988
Sold by
Wolff Thomas J
Bought by
Snow Kenneth
Create a Home Valuation Report for This Property
The Home Valuation Report is an in-depth analysis detailing your home's value as well as a comparison with similar homes in the area
Home Values in the Area
Average Home Value in this Area
Purchase History
| Date | Buyer | Sale Price | Title Company |
|---|---|---|---|
| Keane Stephen D | $154,900 | -- | |
| Tillotson D David | $133,000 | -- | |
| Keane Stephen D | $103,500 | -- | |
| Snow Kenneth | $144,000 | -- |
Source: Public Records
Mortgage History
| Date | Status | Borrower | Loan Amount |
|---|---|---|---|
| Open | Snow Kenneth | $266,529 | |
| Closed | Snow Kenneth | $260,800 |
Source: Public Records
Tax History Compared to Growth
Tax History
| Year | Tax Paid | Tax Assessment Tax Assessment Total Assessment is a certain percentage of the fair market value that is determined by local assessors to be the total taxable value of land and additions on the property. | Land | Improvement |
|---|---|---|---|---|
| 2025 | $6,836 | $500,100 | $261,600 | $238,500 |
| 2024 | $6,635 | $471,900 | $246,800 | $225,100 |
| 2023 | $6,441 | $423,200 | $216,600 | $206,600 |
| 2022 | $6,208 | $370,600 | $188,300 | $182,300 |
| 2021 | $5,832 | $337,500 | $171,200 | $166,300 |
| 2020 | $5,660 | $323,400 | $163,000 | $160,400 |
| 2019 | $5,561 | $310,300 | $155,300 | $155,000 |
| 2018 | $5,389 | $295,800 | $162,300 | $133,500 |
| 2017 | $5,246 | $283,900 | $162,300 | $121,600 |
| 2016 | $5,076 | $274,500 | $156,100 | $118,400 |
| 2015 | $4,849 | $254,800 | $145,900 | $108,900 |
| 2014 | $4,581 | $249,800 | $143,100 | $106,700 |
Source: Public Records
Map
Nearby Homes