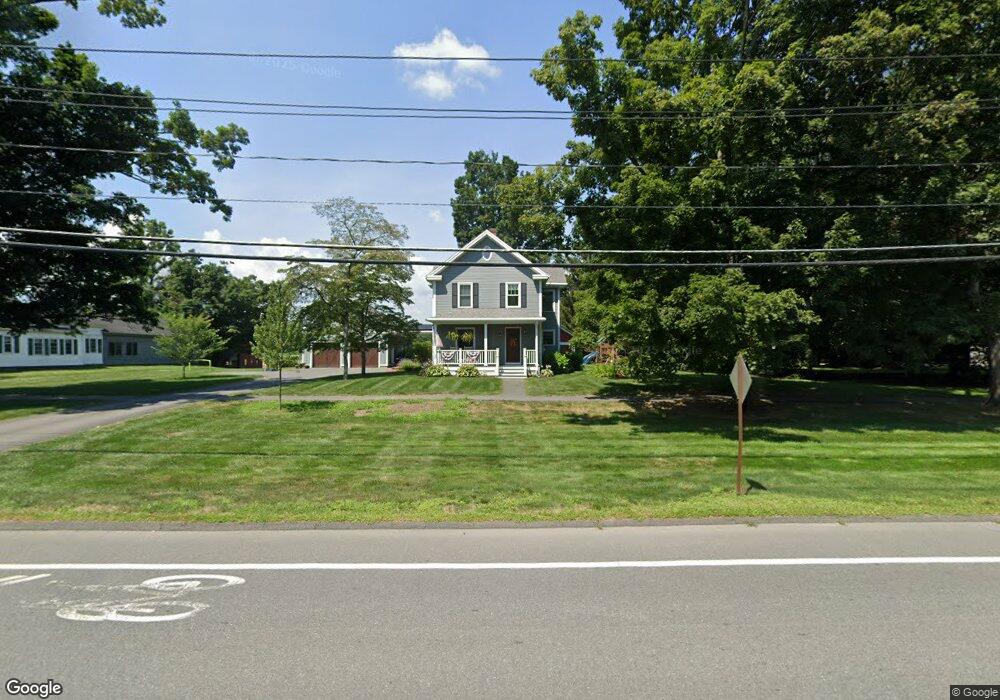
51 S Main St Sunderland, MA 01375
Estimated Value: $537,986 - $668,000
4
Beds
2
Baths
2,520
Sq Ft
$234/Sq Ft
Est. Value
About This Home
This home is located at 51 S Main St, Sunderland, MA 01375 and is currently estimated at $588,747, approximately $233 per square foot. 51 S Main St is a home located in Franklin County with nearby schools including Sunderland Elementary School and Frontier Regional School.
Ownership History
Date
Name
Owned For
Owner Type
Purchase Details
Closed on
May 18, 2015
Sold by
Kennedy Kathleen and Korpita Paul
Bought by
Korpita Dylan
Current Estimated Value
Purchase Details
Closed on
Apr 19, 2013
Sold by
Korpita Irt
Bought by
Arnold Kenneth D and Arnold Wendy L
Purchase Details
Closed on
Jun 27, 2008
Sold by
Korpita Regina K
Bought by
Korpita Paul S
Create a Home Valuation Report for This Property
The Home Valuation Report is an in-depth analysis detailing your home's value as well as a comparison with similar homes in the area
Home Values in the Area
Average Home Value in this Area
Purchase History
| Date | Buyer | Sale Price | Title Company |
|---|---|---|---|
| Korpita Dylan | $240,000 | -- | |
| Korpita Paul | -- | -- | |
| Arnold Kenneth D | -- | -- | |
| Korpita Irt | -- | -- | |
| Korpita Paul S | -- | -- |
Source: Public Records
Mortgage History
| Date | Status | Borrower | Loan Amount |
|---|---|---|---|
| Previous Owner | Korpita Irt | $25,000 |
Source: Public Records
Tax History Compared to Growth
Tax History
| Year | Tax Paid | Tax Assessment Tax Assessment Total Assessment is a certain percentage of the fair market value that is determined by local assessors to be the total taxable value of land and additions on the property. | Land | Improvement |
|---|---|---|---|---|
| 2025 | $72 | $556,500 | $133,800 | $422,700 |
| 2024 | $7,312 | $556,500 | $133,800 | $422,700 |
| 2023 | $6,728 | $525,600 | $121,700 | $403,900 |
| 2022 | $6,818 | $463,800 | $104,300 | $359,500 |
| 2021 | $6,462 | $417,200 | $96,600 | $320,600 |
| 2020 | $6,451 | $417,800 | $96,600 | $321,200 |
| 2019 | $6,252 | $407,800 | $93,900 | $313,900 |
| 2018 | $3,701 | $246,700 | $90,000 | $156,700 |
| 2017 | $3,476 | $242,400 | $90,000 | $152,400 |
| 2016 | $3,658 | $249,500 | $92,300 | $157,200 |
| 2015 | $3,540 | $247,400 | $92,300 | $155,100 |
| 2014 | $3,459 | $247,400 | $92,300 | $155,100 |
Source: Public Records
Map
Nearby Homes
- 110 Old Amherst Rd
- 146 Old Amherst Rd
- 238 N Main St
- Lot C Mountain Rd
- Lot A Mountain Rd
- Lot B Mountain Rd
- 15 Crestview Dr
- 33 Eastern Ave
- 24 Graves St
- 24 Elm St
- 134 Montague Rd
- 13 Capt Lathrop Dr
- 7 Stage Rd
- 0 Pocumtuck Dr Unit 73379330
- 15 S Plain Rd
- 32 Swamp Rd
- 208 Greenfield Rd
- 10 Depot Rd
- 0 North St Unit 73407299
- 73 Depot Rd