Estimated Value: $203,000 - $217,000
3
Beds
1
Bath
1,380
Sq Ft
$154/Sq Ft
Est. Value
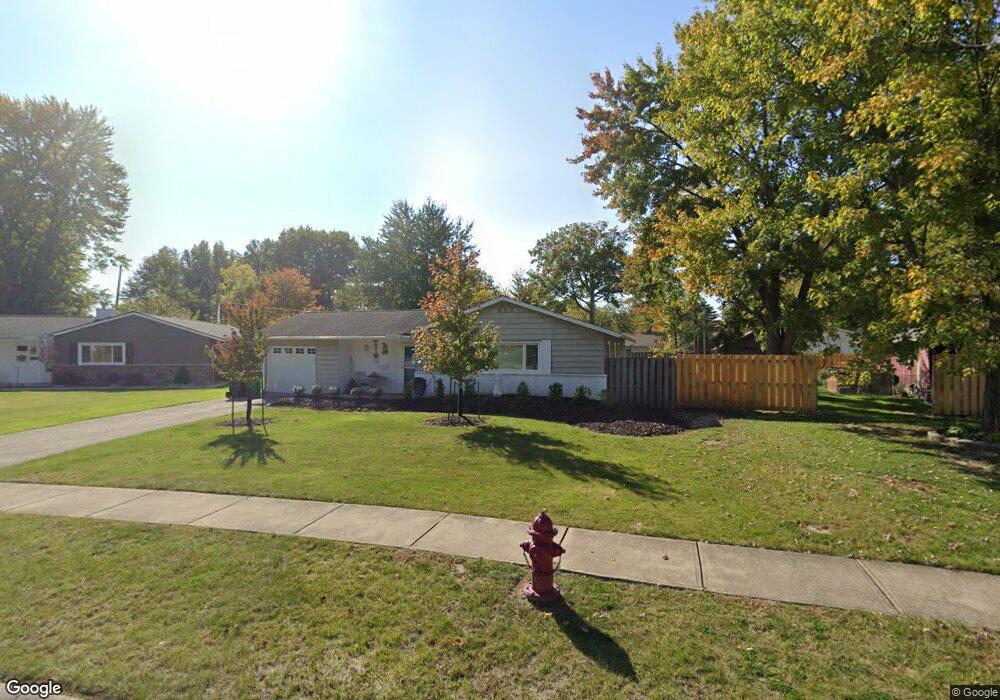
About This Home
This home is located at 51 Whitehall Dr, Berea, OH 44017 and is currently estimated at $212,118, approximately $153 per square foot. 51 Whitehall Dr is a home located in Cuyahoga County with nearby schools including Grindstone Elementary School, Berea-Midpark Middle School, and Berea-Midpark High School.
Ownership History
Date
Name
Owned For
Owner Type
Purchase Details
Closed on
May 24, 2024
Sold by
Roe Jane Kirkwood
Bought by
Boskovitch Karen
Current Estimated Value
Purchase Details
Closed on
Oct 17, 2019
Sold by
Roe Jane Kirkwood
Bought by
Roe Jane Kirkwood and Boskovitch Karen
Purchase Details
Closed on
Apr 29, 1994
Sold by
Spanulo Mark G and Spanulo Jill A
Bought by
Roe Jane Kirkwood
Purchase Details
Closed on
Oct 15, 1987
Sold by
Hardy Dora Anne A K A
Bought by
Spanulo Mark G and Spanulo Jill A
Purchase Details
Closed on
Sep 30, 1987
Sold by
Hardy Daniel G and Hardy Dora A
Bought by
Hardy Dora Anne A K A
Purchase Details
Closed on
Jun 18, 1986
Sold by
Ritter Richard A
Bought by
Hardy Daniel G and Hardy Dora A
Purchase Details
Closed on
Mar 18, 1980
Sold by
Lesko Donald J and Lesko Barbara A
Bought by
Ritter Richard A
Purchase Details
Closed on
Jan 1, 1975
Bought by
Lesko Donald J and Lesko Barbara A
Create a Home Valuation Report for This Property
The Home Valuation Report is an in-depth analysis detailing your home's value as well as a comparison with similar homes in the area
Home Values in the Area
Average Home Value in this Area
Purchase History
| Date | Buyer | Sale Price | Title Company |
|---|---|---|---|
| Boskovitch Karen | -- | None Listed On Document | |
| Roe Jane Kirkwood | -- | None Available | |
| Roe Jane Kirkwood | $97,000 | -- | |
| Spanulo Mark G | $73,500 | -- | |
| Hardy Dora Anne A K A | -- | -- | |
| Hardy Daniel G | $67,900 | -- | |
| Ritter Richard A | $58,000 | -- | |
| Lesko Donald J | -- | -- |
Source: Public Records
Tax History
| Year | Tax Paid | Tax Assessment Tax Assessment Total Assessment is a certain percentage of the fair market value that is determined by local assessors to be the total taxable value of land and additions on the property. | Land | Improvement |
|---|---|---|---|---|
| 2025 | $2,911 | $60,130 | $14,035 | $46,095 |
| 2024 | $2,922 | $60,130 | $14,035 | $46,095 |
| 2023 | $2,448 | $44,420 | $12,010 | $32,410 |
| 2022 | $2,461 | $44,415 | $12,005 | $32,410 |
| 2021 | $2,438 | $44,420 | $12,010 | $32,410 |
| 2020 | $2,231 | $37,660 | $10,190 | $27,480 |
| 2019 | $2,172 | $107,600 | $29,100 | $78,500 |
| 2018 | $2,125 | $37,660 | $10,190 | $27,480 |
| 2017 | $2,237 | $36,540 | $9,450 | $27,090 |
| 2016 | $2,220 | $36,540 | $9,450 | $27,090 |
| 2015 | $2,244 | $36,540 | $9,450 | $27,090 |
| 2014 | $2,244 | $38,470 | $9,940 | $28,530 |
Source: Public Records
Map
Nearby Homes
- 53 Greenfield Ct
- 8036 Fair Rd
- 516 Fair St
- 8902 Lincolnshire Blvd
- 49 Monroe St
- 169 Kempton Dr
- 275 Quarrystone Ln
- 487 Bridle Ln
- 0 Sprague Rd Unit 5192975
- 23004 Chandlers Ln Unit 4-344
- 23003 Chandlers Ln Unit 224
- 23002 Chandlers Ln
- 23002 Chandlers Ln Unit 221
- 380 Adrian Dr
- 9753 Prospect Rd
- 23155 Wainwright Terrace
- 7640 S Eastland Rd
- 21032 Breckenridge Ln
- 23265 Wainwright Terrace
- 57 Riverside Dr
- 59 Whitehall Dr
- 47 Whitehall Dr
- 741 Walwick Ct
- 745 Walwick Ct
- 75 Whitehall Dr
- 43 Whitehall Dr
- 42 Whitehall Dr
- 749 Walwick Ct
- 39 Whitehall Dr
- 48 Whitehall Dr
- 66 Whitehall Dr
- 60 Whitehall Dr
- 72 Whitehall Dr
- 740 Walwick Ct
- 54 Whitehall Dr
- 78 Whitehall Dr
- 89 Whitehall Dr
- 35 Whitehall Dr
- 36 Whitehall Dr
- 748 Walwick Ct
Your Personal Tour Guide
Ask me questions while you tour the home.