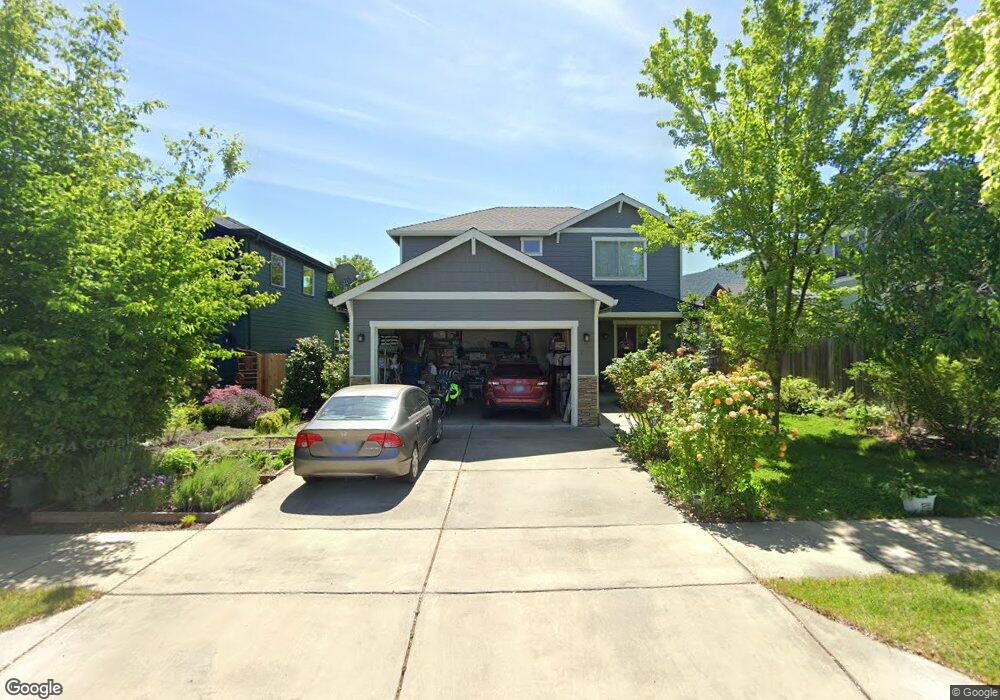
510 E Nerton St Unit 38 Talent, OR 97540
Estimated Value: $531,537 - $561,000
3
Beds
3
Baths
2,150
Sq Ft
$254/Sq Ft
Est. Value
About This Home
This home is located at 510 E Nerton St Unit 38, Talent, OR 97540 and is currently estimated at $546,884, approximately $254 per square foot. 510 E Nerton St Unit 38 is a home located in Jackson County with nearby schools including Talent Elementary School, Talent Middle School, and Phoenix High School.
Ownership History
Date
Name
Owned For
Owner Type
Purchase Details
Closed on
Sep 26, 2018
Sold by
Mueller K Tysen and Mueller Diane E
Bought by
Mueller K Tysen and Mueller Diane E
Current Estimated Value
Purchase Details
Closed on
Feb 9, 2017
Sold by
Cropper Anne Marie and Cropper Blaine T
Bought by
Mueller K Tysen and Mueller Diane E
Home Financials for this Owner
Home Financials are based on the most recent Mortgage that was taken out on this home.
Original Mortgage
$250,000
Outstanding Balance
$206,816
Interest Rate
4.17%
Mortgage Type
New Conventional
Estimated Equity
$340,068
Purchase Details
Closed on
Apr 25, 2008
Sold by
Pmci Inc
Bought by
Cropper Anne Marie and Cropper Blaine T
Home Financials for this Owner
Home Financials are based on the most recent Mortgage that was taken out on this home.
Original Mortgage
$175,000
Interest Rate
5.81%
Mortgage Type
Purchase Money Mortgage
Purchase Details
Closed on
Mar 30, 2007
Sold by
Siskiyou Properties Llc
Bought by
Pmci Inc
Create a Home Valuation Report for This Property
The Home Valuation Report is an in-depth analysis detailing your home's value as well as a comparison with similar homes in the area
Home Values in the Area
Average Home Value in this Area
Purchase History
| Date | Buyer | Sale Price | Title Company |
|---|---|---|---|
| Mueller K Tysen | -- | None Available | |
| Mueller K Tysen | $369,900 | First American Title Ins | |
| Cropper Anne Marie | $335,000 | Amerititle | |
| Pmci Inc | $184,000 | Lawyers Title Ins |
Source: Public Records
Mortgage History
| Date | Status | Borrower | Loan Amount |
|---|---|---|---|
| Open | Mueller K Tysen | $250,000 | |
| Previous Owner | Cropper Anne Marie | $175,000 |
Source: Public Records
Tax History Compared to Growth
Tax History
| Year | Tax Paid | Tax Assessment Tax Assessment Total Assessment is a certain percentage of the fair market value that is determined by local assessors to be the total taxable value of land and additions on the property. | Land | Improvement |
|---|---|---|---|---|
| 2025 | $4,811 | $307,760 | $128,470 | $179,290 |
| 2024 | $4,811 | $298,800 | $124,730 | $174,070 |
| 2023 | $4,660 | $290,100 | $121,100 | $169,000 |
| 2022 | $4,537 | $290,100 | $121,100 | $169,000 |
| 2021 | $4,494 | $281,660 | $117,570 | $164,090 |
| 2020 | $4,355 | $273,460 | $114,140 | $159,320 |
| 2019 | $4,239 | $257,770 | $107,590 | $150,180 |
| 2018 | $4,463 | $250,270 | $104,460 | $145,810 |
| 2017 | $4,223 | $250,270 | $104,460 | $145,810 |
| 2016 | $4,093 | $235,920 | $98,460 | $137,460 |
| 2015 | $3,930 | $235,920 | $98,460 | $137,460 |
| 2014 | $3,774 | $222,380 | $92,800 | $129,580 |
Source: Public Records
Map
Nearby Homes
- 0 S Pacific Hwy Unit 220205677
- 0 S Pacific Hwy Unit 733938540
- 0 S Pacific Hwy Unit 220210809
- 335 Meadow Slope Dr
- 465 Arnos St
- 260 Arnos St
- 345 Blackberry Ct
- 1720 Talent Ave
- 60 Talent Ave
- 202 Pleasant View
- 71 William Way
- 312 E Rapp Rd
- 333 Mountain View Dr Unit 53
- 333 Mountain View Dr Unit 26
- 333 Mountain View Dr Unit 18
- 333 Mountain View Dr Unit 121
- 333 Mountain View Dr Unit 70
- 333 Mountain View Dr Unit 86
- 333 Mountain View Dr Unit 10
- 333 Mountain View Dr Unit 165
- 510 E Nerton St
- 512 E Nerton St
- 512 E Nerton St Unit 39
- 1101 Lithia Way Unit 37
- 1101 Lithia Way
- 1105 Lithia Way Unit 18
- 1226 Kamerin Springs Dr Unit 34
- 1226 Kamerin Springs Dr
- 1224 Kamerin Springs Dr Unit 33
- 1224 Kamerin Springs Dr
- 1100 Kamerin Springs
- 1100 Kamerin Springs Dr Unit 30
- 1100 Kamerin Springs Dr
- 1108 Kamerin Springs Dr
- 1033 Lithia Way Unit 40
- 1033 Lithia Way
- 1117 Lithia Way Unit 35
- 1117 Lithia Way
- 514 Nerton St
- 1114 Kamerin Springs Dr Unit 32