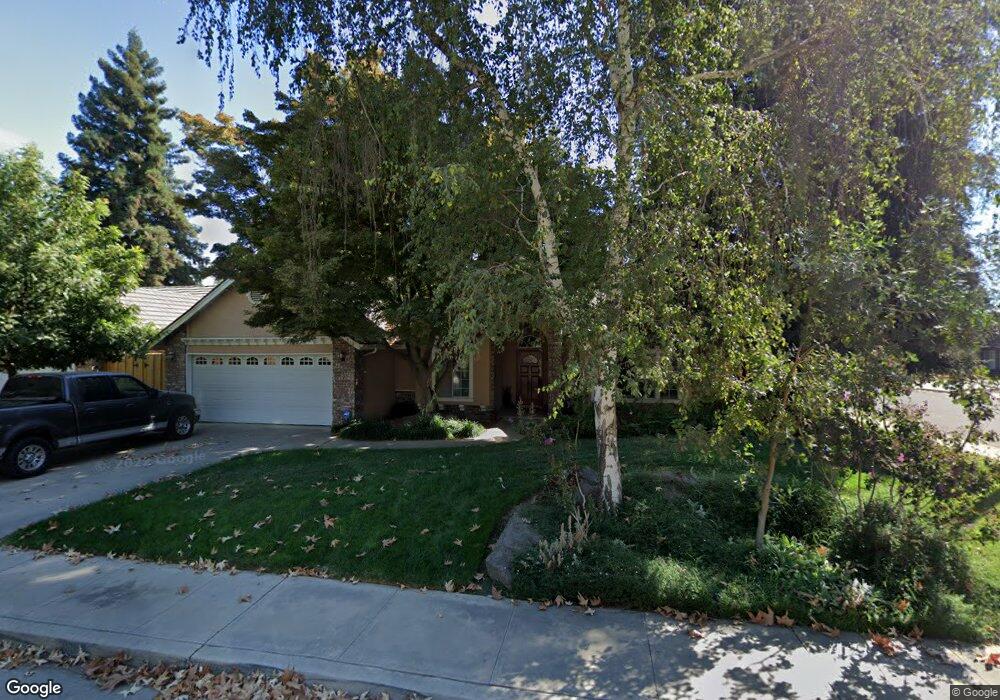
510 N Roeben Ct Visalia, CA 93291
Northwest Visalia NeighborhoodEstimated Value: $446,000 - $524,000
3
Beds
2
Baths
2,250
Sq Ft
$216/Sq Ft
Est. Value
About This Home
This home is located at 510 N Roeben Ct, Visalia, CA 93291 and is currently estimated at $485,958, approximately $215 per square foot. 510 N Roeben Ct is a home located in Tulare County with nearby schools including Hurley Elementary School, Ridgeview Middle, and Redwood High School.
Ownership History
Date
Name
Owned For
Owner Type
Purchase Details
Closed on
May 5, 2011
Sold by
Price Thomas J
Bought by
Westly Deborah S
Current Estimated Value
Home Financials for this Owner
Home Financials are based on the most recent Mortgage that was taken out on this home.
Original Mortgage
$192,000
Outstanding Balance
$132,505
Interest Rate
4.73%
Mortgage Type
New Conventional
Estimated Equity
$353,453
Purchase Details
Closed on
Dec 6, 1999
Sold by
Garman Michael L
Bought by
Price Thomas J and Price Cheryl L
Home Financials for this Owner
Home Financials are based on the most recent Mortgage that was taken out on this home.
Original Mortgage
$120,000
Interest Rate
7.68%
Purchase Details
Closed on
Sep 3, 1998
Sold by
Centex International Inc
Bought by
Garman Michael L and Garman Cindy A
Create a Home Valuation Report for This Property
The Home Valuation Report is an in-depth analysis detailing your home's value as well as a comparison with similar homes in the area
Home Values in the Area
Average Home Value in this Area
Purchase History
| Date | Buyer | Sale Price | Title Company |
|---|---|---|---|
| Westly Deborah S | $240,000 | Chicago Title Company | |
| Price Thomas J | $150,000 | First American Title Co | |
| Garman Michael L | $53,500 | Chicago Title Co |
Source: Public Records
Mortgage History
| Date | Status | Borrower | Loan Amount |
|---|---|---|---|
| Open | Westly Deborah S | $192,000 | |
| Previous Owner | Price Thomas J | $120,000 |
Source: Public Records
Tax History Compared to Growth
Tax History
| Year | Tax Paid | Tax Assessment Tax Assessment Total Assessment is a certain percentage of the fair market value that is determined by local assessors to be the total taxable value of land and additions on the property. | Land | Improvement |
|---|---|---|---|---|
| 2025 | $3,164 | $307,479 | $51,245 | $256,234 |
| 2024 | $3,164 | $301,451 | $50,241 | $251,210 |
| 2023 | $3,076 | $295,541 | $49,256 | $246,285 |
| 2022 | $2,937 | $289,747 | $48,291 | $241,456 |
| 2021 | $2,939 | $284,066 | $47,344 | $236,722 |
| 2020 | $2,919 | $281,154 | $46,859 | $234,295 |
| 2019 | $2,829 | $275,641 | $45,940 | $229,701 |
| 2018 | $2,761 | $270,236 | $45,039 | $225,197 |
| 2017 | $2,726 | $264,937 | $44,156 | $220,781 |
| 2016 | $2,679 | $259,742 | $43,290 | $216,452 |
| 2015 | $2,410 | $255,841 | $42,640 | $213,201 |
| 2014 | $2,410 | $233,000 | $58,000 | $175,000 |
Source: Public Records
Map
Nearby Homes
- 6040 W Hurley Ave
- 245 N Boise St
- 707 N Branson Ct
- 415 N Akers St Unit 50
- 415 N Akers St Unit 117
- 415 N Akers St Unit 48
- 415 N Akers St Unit 121
- 415 N Akers Spc 6 St
- 141 N Boise Ct
- 5502 W Nicholas Ct
- 415 N Akers St Unit 9
- 415 N Akers St Unit 17
- 415 N Akers St Unit 84
- 144 S Roeben Ct
- 5837 W Stewart Ave
- 6346 W Burrel Ct
- 225 N Akers St Unit 308
- Sparrow Plan at Shepherds Ranch
- Lark Plan at Shepherds Ranch
- Wren Plan at Shepherds Ranch
- 520 N Roeben Ct
- 511 N Anthony Ct
- 521 N Anthony Ct
- 528 N Roeben Ct
- 6031 W Damsen Ave
- 6009 W Damsen Ave
- 533 N Anthony Ct
- 6001 W Damsen Ave
- 540 N Roeben Ct
- 5941 W Damsen Ave
- 6018 W School Ct
- 531 N Roeben Ct
- 6010 W School Ct
- 528 N Anthony Ct Unit 4
- 350 N Boise St
- 5928 W Damsen Ave
- 539 N Roeben Ct
- 6000 W School Ct
- 6100 W School Ave
- 522 N Anthony Ct