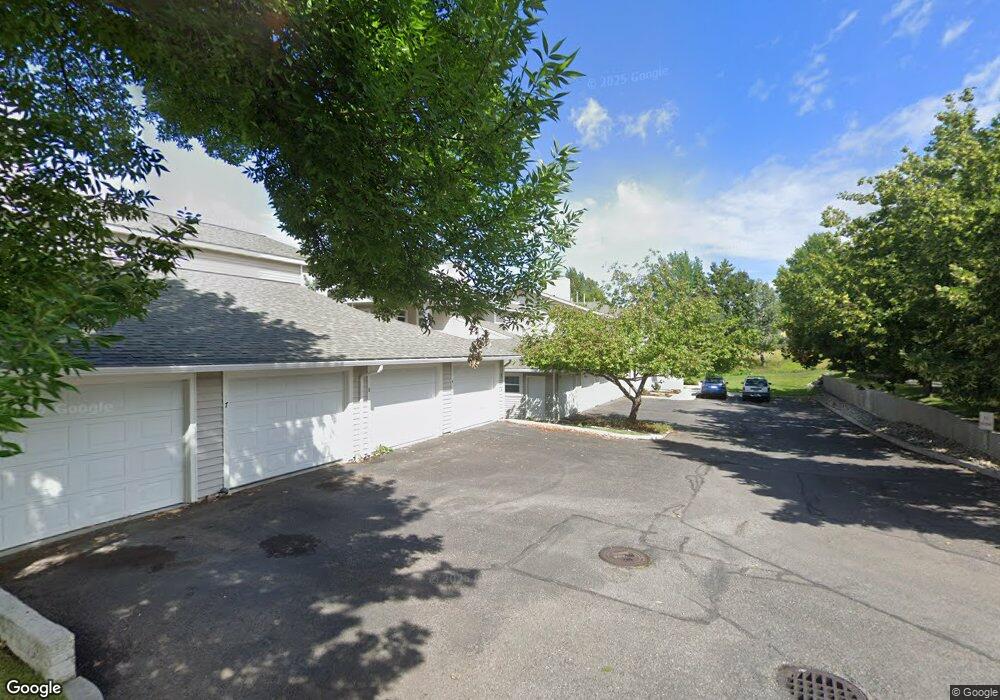
5102 Village View Way Unit 2 Missoula, MT 59803
Moose Can Gully NeighborhoodEstimated Value: $382,089 - $404,000
2
Beds
2
Baths
1,134
Sq Ft
$345/Sq Ft
Est. Value
About This Home
This home is located at 5102 Village View Way Unit 2, Missoula, MT 59803 and is currently estimated at $391,522, approximately $345 per square foot. 5102 Village View Way Unit 2 is a home located in Missoula County with nearby schools including Chief Charlo School, Meadow Hill Middle School, and Sentinel High School.
Ownership History
Date
Name
Owned For
Owner Type
Purchase Details
Closed on
Jun 11, 2018
Sold by
Buck Frances M and Buck Maren Emily
Bought by
Gall Jerry L and Gall Margaret R
Current Estimated Value
Purchase Details
Closed on
May 19, 2010
Sold by
Russo Edwin V and Russo Bonnie J
Bought by
Buck Frances M and Buck Maren Emily
Purchase Details
Closed on
Nov 19, 2009
Sold by
The First Amended & Restated Rea K Hook
Bought by
Russo Revocable Trust
Home Financials for this Owner
Home Financials are based on the most recent Mortgage that was taken out on this home.
Original Mortgage
$7,250
Interest Rate
4.88%
Mortgage Type
Seller Take Back
Purchase Details
Closed on
Jun 5, 2008
Sold by
Hook Rea K
Bought by
The First Amended & Restated Rea K Hook
Purchase Details
Closed on
May 29, 2008
Sold by
R & H Development Llc
Bought by
Hook Rea K
Create a Home Valuation Report for This Property
The Home Valuation Report is an in-depth analysis detailing your home's value as well as a comparison with similar homes in the area
Home Values in the Area
Average Home Value in this Area
Purchase History
| Date | Buyer | Sale Price | Title Company |
|---|---|---|---|
| Gall Jerry L | -- | Western Title & Escrow | |
| Buck Frances M | -- | Insured Titles Llc | |
| Russo Revocable Trust | -- | None Available | |
| The First Amended & Restated Rea K Hook | -- | None Available | |
| Hook Rea K | -- | None Available |
Source: Public Records
Mortgage History
| Date | Status | Borrower | Loan Amount |
|---|---|---|---|
| Previous Owner | Russo Revocable Trust | $7,250 |
Source: Public Records
Tax History Compared to Growth
Tax History
| Year | Tax Paid | Tax Assessment Tax Assessment Total Assessment is a certain percentage of the fair market value that is determined by local assessors to be the total taxable value of land and additions on the property. | Land | Improvement |
|---|---|---|---|---|
| 2025 | $834 | $406,700 | $109,044 | $297,656 |
| 2024 | $2,237 | $283,100 | $30,097 | $253,003 |
| 2023 | $2,719 | $283,100 | $18,045 | $265,055 |
| 2022 | $1,884 | $230,200 | $0 | $0 |
| 2021 | $2,797 | $230,200 | $0 | $0 |
| 2020 | $1,982 | $203,100 | $0 | $0 |
| 2019 | $1,978 | $203,100 | $0 | $0 |
| 2018 | $2,389 | $170,600 | $0 | $0 |
| 2017 | $2,353 | $170,600 | $0 | $0 |
| 2016 | $2,483 | $188,300 | $0 | $0 |
| 2015 | $2,204 | $188,300 | $0 | $0 |
| 2014 | $2,398 | $115,487 | $0 | $0 |
Source: Public Records
Map
Nearby Homes
- 5142 Clearview Way
- 2227 E Crescent Dr
- 2340 55th St Unit 7
- 5602 Mainview Dr
- 5605 Ebb Way
- 2207 Garland Dr
- 2407 55th St
- 4406 Harrison Scott Dr
- Nhn Hillview Way
- 4607 Hillview Way
- 2424 55th St
- 2120 42nd St
- 115 Kinnikinnick Ct
- 1645 Shadow Ln
- 2517 Southhills Dr
- 2615 Gharrett St
- 106 Willow Ridge Ct
- 106 Erika Ct
- 1246 Colter Ct
- 6308 Hillview Way
- 5102 Village View Way
- 5102 Village View Way
- 5102 Village View Way
- 5102 Village View Way
- 5102 Village View Way
- 5102 Village View Way
- 5102 Village View Way Unit 5
- 5102 Village View Way Unit 4
- 5102 Village View Way Unit 6
- 5104 Village View Way
- 5104 Village View Way
- 5104 Village View Way
- 5104 Village View Way
- 5104 Village View Way
- 5104 Village View Way
- 5104 Village View Way
- 5104 Village View Way
- 5104 Village View Way Unit 5
- 5104 Village View Way Unit 1
- 5104 Village View Way Unit 3