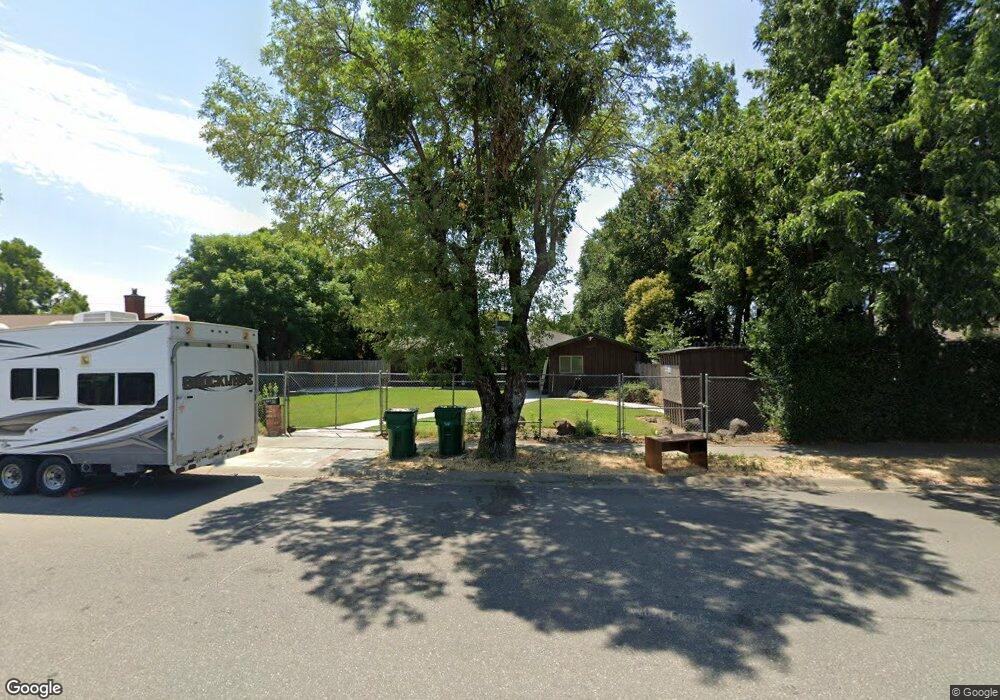
511 Walnut St Corning, CA 96021
Estimated Value: $256,000 - $351,000
3
Beds
2
Baths
1,500
Sq Ft
$203/Sq Ft
Est. Value
About This Home
This home is located at 511 Walnut St, Corning, CA 96021 and is currently estimated at $303,846, approximately $202 per square foot. 511 Walnut St is a home located in Tehama County with nearby schools including Olive View Elementary School, Maywood Middle School, and Corning High School.
Ownership History
Date
Name
Owned For
Owner Type
Purchase Details
Closed on
Mar 15, 2021
Sold by
Barnes Cole T and Barnes Jordin T
Bought by
Dahlgren Gary W
Current Estimated Value
Home Financials for this Owner
Home Financials are based on the most recent Mortgage that was taken out on this home.
Original Mortgage
$145,600
Outstanding Balance
$130,520
Interest Rate
2.7%
Mortgage Type
New Conventional
Estimated Equity
$173,326
Purchase Details
Closed on
Feb 3, 2017
Sold by
Barnes Nakoda T
Bought by
Barnes Cole T
Home Financials for this Owner
Home Financials are based on the most recent Mortgage that was taken out on this home.
Original Mortgage
$137,362
Interest Rate
4.4%
Mortgage Type
FHA
Purchase Details
Closed on
Mar 10, 2016
Sold by
Barnes Roy T
Bought by
Barnes Nakoda T and Barnes Cole T
Create a Home Valuation Report for This Property
The Home Valuation Report is an in-depth analysis detailing your home's value as well as a comparison with similar homes in the area
Purchase History
| Date | Buyer | Sale Price | Title Company |
|---|---|---|---|
| Dahlgren Gary W | $182,000 | Placer Title | |
| Barnes Cole T | $95,000 | Northern California Title Co | |
| Barnes Nakoda T | -- | None Available |
Source: Public Records
Mortgage History
| Date | Status | Borrower | Loan Amount |
|---|---|---|---|
| Open | Dahlgren Gary W | $145,600 | |
| Previous Owner | Barnes Cole T | $137,362 |
Source: Public Records
Tax History
| Year | Tax Paid | Tax Assessment Tax Assessment Total Assessment is a certain percentage of the fair market value that is determined by local assessors to be the total taxable value of land and additions on the property. | Land | Improvement |
|---|---|---|---|---|
| 2025 | $2,033 | $196,999 | $43,296 | $153,703 |
| 2023 | $1,994 | $189,352 | $41,616 | $147,736 |
| 2022 | $1,966 | $185,640 | $40,800 | $144,840 |
| 2021 | $1,923 | $184,954 | $34,846 | $150,108 |
| 2020 | $1,944 | $183,058 | $34,489 | $148,569 |
| 2019 | $1,864 | $179,469 | $33,813 | $145,656 |
| 2018 | $1,867 | $175,950 | $33,150 | $142,800 |
| 2017 | $1,667 | $155,000 | $30,000 | $125,000 |
| 2016 | $1,017 | $99,208 | $24,723 | $74,485 |
| 2015 | $940 | $97,719 | $24,352 | $73,367 |
| 2014 | $922 | $95,805 | $23,875 | $71,930 |
Source: Public Records
Map
Nearby Homes
Your Personal Tour Guide
Ask me questions while you tour the home.