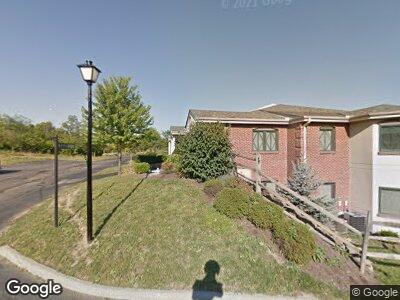
5111 Northbend Crossing Unit 131 Cincinnati, OH 45247
West Monfort Heights NeighborhoodEstimated Value: $202,567 - $215,000
2
Beds
2
Baths
1,260
Sq Ft
$166/Sq Ft
Est. Value
About This Home
This home is located at 5111 Northbend Crossing Unit 131, Cincinnati, OH 45247 and is currently estimated at $208,892, approximately $165 per square foot. 5111 Northbend Crossing Unit 131 is a home located in Hamilton County with nearby schools including Monfort Heights Elementary School, White Oak Middle School, and Colerain High School.
Ownership History
Date
Name
Owned For
Owner Type
Purchase Details
Closed on
Aug 3, 2017
Sold by
Flaherty Patrick J and Flaherty Paula M
Bought by
Haring Sylvia and Sylvia Haring Revocable Trust
Current Estimated Value
Purchase Details
Closed on
May 23, 2017
Sold by
Pjf Properties Llc
Bought by
Flaherty Patrick J and Flaherty Paula M
Purchase Details
Closed on
Jan 28, 2009
Sold by
Fannie Mae
Bought by
Pjf Properties Llc
Purchase Details
Closed on
Mar 20, 2008
Sold by
Shorten George E and Shorten Janet L
Bought by
Federal National Mortgage Association
Purchase Details
Closed on
Jun 30, 2004
Sold by
S/Nbl Associates
Bought by
Shorten George E and Shorten Janet L
Home Financials for this Owner
Home Financials are based on the most recent Mortgage that was taken out on this home.
Original Mortgage
$150,300
Interest Rate
7.25%
Mortgage Type
Fannie Mae Freddie Mac
Create a Home Valuation Report for This Property
The Home Valuation Report is an in-depth analysis detailing your home's value as well as a comparison with similar homes in the area
Home Values in the Area
Average Home Value in this Area
Purchase History
| Date | Buyer | Sale Price | Title Company |
|---|---|---|---|
| Haring Sylvia | $124,900 | Springdale Title Llc | |
| Flaherty Patrick J | -- | None Available | |
| Pjf Properties Llc | -- | None Available | |
| Federal National Mortgage Association | $102,000 | None Available | |
| Shorten George E | $150,400 | -- |
Source: Public Records
Mortgage History
| Date | Status | Borrower | Loan Amount |
|---|---|---|---|
| Previous Owner | Shorten George E | $163,400 | |
| Previous Owner | Shorten George E | $150,300 |
Source: Public Records
Tax History Compared to Growth
Tax History
| Year | Tax Paid | Tax Assessment Tax Assessment Total Assessment is a certain percentage of the fair market value that is determined by local assessors to be the total taxable value of land and additions on the property. | Land | Improvement |
|---|---|---|---|---|
| 2024 | $3,126 | $59,017 | $10,325 | $48,692 |
| 2023 | $3,142 | $59,017 | $10,325 | $48,692 |
| 2022 | $2,849 | $43,716 | $8,012 | $35,704 |
| 2021 | $2,611 | $43,716 | $8,012 | $35,704 |
| 2020 | $2,637 | $43,716 | $8,012 | $35,704 |
| 2019 | $2,476 | $37,184 | $7,350 | $29,834 |
| 2018 | $2,205 | $37,184 | $7,350 | $29,834 |
| 2017 | $2,185 | $37,184 | $7,350 | $29,834 |
| 2016 | $1,856 | $30,755 | $6,395 | $24,360 |
| 2015 | $1,847 | $30,755 | $6,395 | $24,360 |
| 2014 | $1,853 | $30,755 | $6,395 | $24,360 |
| 2013 | $1,996 | $35,350 | $7,350 | $28,000 |
Source: Public Records
Map
Nearby Homes
- 5175 N Bend Crossing
- 5183 N Bend Crossing
- 5372 Meadow Walk Ln
- 5433 Cecilia Ct
- 5440 Asbury Lake Dr
- 5483 Asbury Lake Dr
- 4212 Boomer Rd
- 5491 Asbury Lake Dr
- 5175 Deeridge Ln
- 5610 Nickview Dr
- 5233 Ivy Rose Ln
- 5229 Ivy Rose Ln
- 5441 Philloret Dr
- 3380 N Bend Rd
- 5310 Timberchase Ct
- 3838 Lincoln Rd
- 5765 Cheviot Rd
- 3375 Palmhill Ln
- 5682 Lauderdale Dr
- 3314 N Bend Rd
- 5109 Northbend Crossing Unit 135
- 5117 Northbend Crossing Unit 134
- 5107 Northbend Crossing Unit 136
- 5115 Northbend Crossing Unit 133
- 5113 Northbend Crossing Unit 132
- 5105 Northbend Crossing Unit 137
- 5111 Northbend Crossing Unit 131
- 5113 N Bend Crossing Unit 13-2
- 5113 N Bend Crossing
- 5109 N Bend Crossing
- 5115 N Bend Crossing
- 5117 N Bend Crossing
- 5109 N Bend Crossing
- 5105 N Bend Crossing
- 5151 N Bend Crossing
- 5151 Northbend Crossing Unit 107
- 5103 N Bend Crossing
- 5153 N Bend Crossing Unit 10-6
- 5103 Northbend Crossing Unit 143
- 5123 Northbend Crossing Unit 142