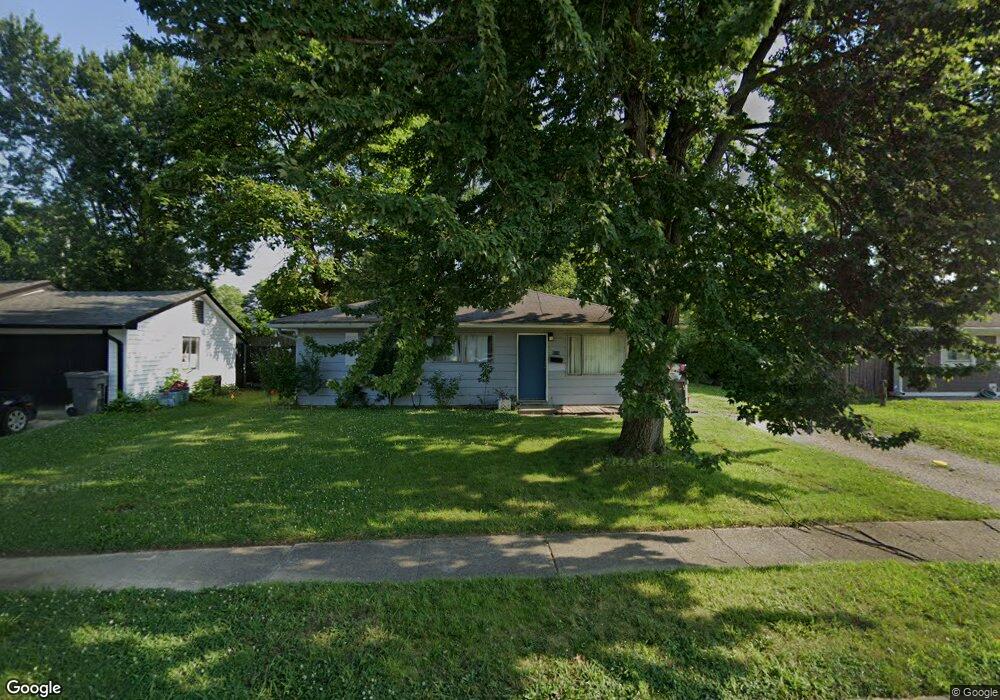
5116 W Deborah St Indianapolis, IN 46224
Eagledale NeighborhoodEstimated Value: $120,000 - $173,000
3
Beds
1
Bath
925
Sq Ft
$162/Sq Ft
Est. Value
About This Home
This home is located at 5116 W Deborah St, Indianapolis, IN 46224 and is currently estimated at $149,857, approximately $162 per square foot. 5116 W Deborah St is a home located in Marion County with nearby schools including Carl Wilde School 79, Lew Wallace School 107, and Meredith Nicholson School 96.
Ownership History
Date
Name
Owned For
Owner Type
Purchase Details
Closed on
Feb 4, 2021
Sold by
Atn Investments Llc
Bought by
Job Capita Llc
Current Estimated Value
Purchase Details
Closed on
Aug 9, 2016
Sold by
Wong Ventures Llc
Bought by
Atn Investments Llc
Purchase Details
Closed on
Jul 15, 2016
Sold by
Atn Investments Llc
Bought by
Jimenez Jimenez Edelia Yael Santiago Edelia Yael Santiago and Jimenez Lopez Margarita
Purchase Details
Closed on
Jul 16, 2015
Sold by
Red Bird Residential Homes Llc
Bought by
Wrong Ventures Llc
Purchase Details
Closed on
Jan 16, 2013
Sold by
Haymore Member Joseph
Bought by
Keracher Member Mike
Purchase Details
Closed on
Dec 26, 2012
Sold by
Hcm Investments Llc
Bought by
Vision Equity Llc
Purchase Details
Closed on
Dec 18, 2012
Sold by
Tucker Member Jeremy
Bought by
Haymore Member Joseph
Create a Home Valuation Report for This Property
The Home Valuation Report is an in-depth analysis detailing your home's value as well as a comparison with similar homes in the area
Home Values in the Area
Average Home Value in this Area
Purchase History
| Date | Buyer | Sale Price | Title Company |
|---|---|---|---|
| Job Capita Llc | -- | None Available | |
| Atn Investments Llc | -- | None Available | |
| Jimenez Jimenez Edelia Yael Santiago Edelia Yael Santiago | $75,000 | None Available | |
| Wrong Ventures Llc | -- | Mtc | |
| Keracher Member Mike | $48,000 | -- | |
| Red Bird Residential Homes Llc | -- | -- | |
| Vision Equity Llc | -- | -- | |
| Haymore Member Joseph | $27,000 | -- |
Source: Public Records
Tax History Compared to Growth
Tax History
| Year | Tax Paid | Tax Assessment Tax Assessment Total Assessment is a certain percentage of the fair market value that is determined by local assessors to be the total taxable value of land and additions on the property. | Land | Improvement |
|---|---|---|---|---|
| 2024 | $2,176 | $92,800 | $5,200 | $87,600 |
| 2023 | $2,176 | $88,000 | $5,200 | $82,800 |
| 2022 | $2,013 | $81,600 | $5,200 | $76,400 |
| 2021 | $1,572 | $64,500 | $5,200 | $59,300 |
| 2020 | $1,372 | $55,700 | $5,200 | $50,500 |
| 2019 | $1,367 | $54,500 | $5,200 | $49,300 |
| 2018 | $1,334 | $52,700 | $5,200 | $47,500 |
| 2017 | $1,263 | $55,800 | $5,200 | $50,600 |
| 2016 | $433 | $54,600 | $5,200 | $49,400 |
| 2014 | $1,080 | $49,900 | $5,200 | $44,700 |
| 2013 | $1,039 | $49,900 | $5,200 | $44,700 |
Source: Public Records
Map
Nearby Homes
- 3302 Allison Ave
- 4917 W 34th St
- 3152 Allison Ave
- 3436 Beeler Ave
- 3433 Welch Dr
- 3119 N Fuller Dr
- 5349 W 36th St
- 4718 W 36th St
- 5507 W 35th St
- 3440 Brewer Dr
- 3148 Keswick Rd
- 4602 W 37th St
- 4513 Patricia St
- 3544 Patton Dr
- 4317 Patricia St
- 3231 Thurston Dr
- 4113 Deborah St
- 3514 Clark Rd
- 5626 Gateway Dr
- 4108 Kalmar Dr
- 5116 Deborah St
- 5122 Deborah St
- 5108 Deborah St
- 5115 W 34th St
- 5121 W 34th St
- 5128 Deborah St
- 5107 W 34th St
- 5115 Deborah St
- 5121 Deborah St
- 5102 W Deborah St
- 5102 Deborah St
- 5107 Deborah St
- 5127 W 34th St
- 5127 Deborah St
- 3352 Winton Ave
- 5132 Deborah St
- 5101 W 34th St
- 5101 Deborah St
- 5131 Deborah St
- 5131 W 34th St