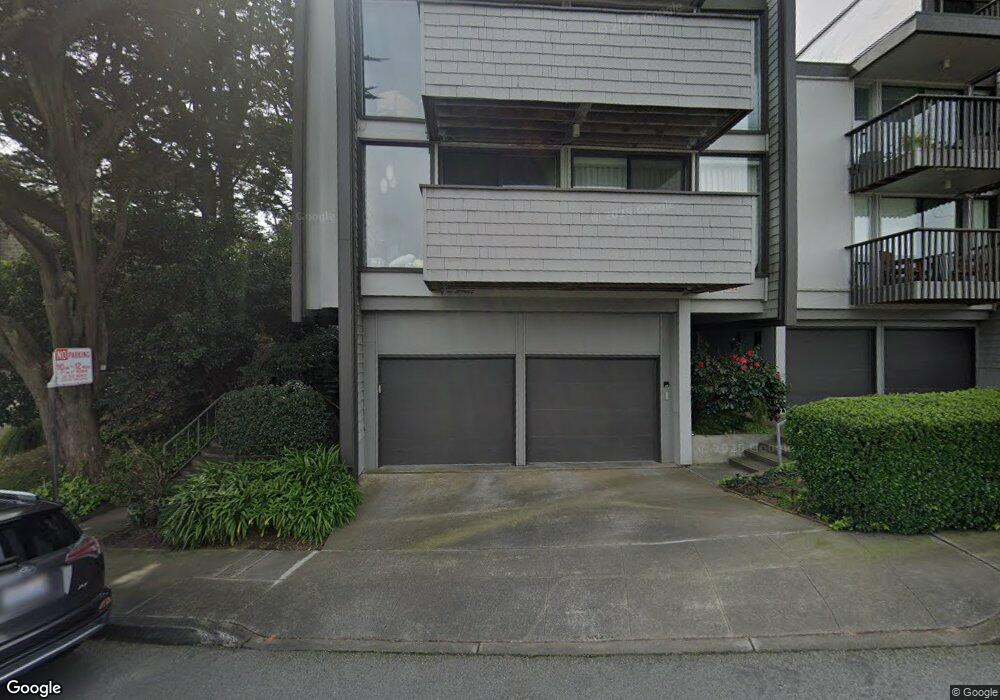
5124 Diamond Heights Blvd Unit A San Francisco, CA 94131
Diamond Heights NeighborhoodEstimated Value: $1,028,000 - $1,269,621
3
Beds
2
Baths
1,482
Sq Ft
$794/Sq Ft
Est. Value
About This Home
This home is located at 5124 Diamond Heights Blvd Unit A, San Francisco, CA 94131 and is currently estimated at $1,176,405, approximately $793 per square foot. 5124 Diamond Heights Blvd Unit A is a home located in San Francisco County with nearby schools including Miraloma Elementary School, Denman (James) Middle School, and St. Philip School.
Ownership History
Date
Name
Owned For
Owner Type
Purchase Details
Closed on
Apr 23, 2021
Sold by
Laufer Mitchell B
Bought by
Zhou Alan Yangyang and Ly Kaitlynn Thao
Current Estimated Value
Home Financials for this Owner
Home Financials are based on the most recent Mortgage that was taken out on this home.
Original Mortgage
$990,000
Outstanding Balance
$893,850
Interest Rate
3%
Mortgage Type
New Conventional
Estimated Equity
$282,555
Purchase Details
Closed on
Apr 1, 2015
Sold by
Linton Bruce W and Linton Cynthia M
Bought by
Laufer Mitchell B
Purchase Details
Closed on
Apr 5, 2005
Sold by
Naify Joan W
Bought by
Linton Bruce W and Linton Cynthia M
Home Financials for this Owner
Home Financials are based on the most recent Mortgage that was taken out on this home.
Original Mortgage
$576,000
Interest Rate
4.87%
Mortgage Type
Purchase Money Mortgage
Create a Home Valuation Report for This Property
The Home Valuation Report is an in-depth analysis detailing your home's value as well as a comparison with similar homes in the area
Home Values in the Area
Average Home Value in this Area
Purchase History
| Date | Buyer | Sale Price | Title Company |
|---|---|---|---|
| Zhou Alan Yangyang | $1,320,000 | North American Title Co Inc | |
| Laufer Mitchell B | $936,000 | Fidelity National Title Co | |
| Linton Bruce W | $720,000 | Chicago Title Company |
Source: Public Records
Mortgage History
| Date | Status | Borrower | Loan Amount |
|---|---|---|---|
| Open | Zhou Alan Yangyang | $990,000 | |
| Previous Owner | Linton Bruce W | $576,000 | |
| Closed | Linton Bruce W | $108,000 |
Source: Public Records
Tax History Compared to Growth
Tax History
| Year | Tax Paid | Tax Assessment Tax Assessment Total Assessment is a certain percentage of the fair market value that is determined by local assessors to be the total taxable value of land and additions on the property. | Land | Improvement |
|---|---|---|---|---|
| 2025 | $14,120 | $1,037,000 | $622,200 | $414,800 |
| 2024 | $14,120 | $1,134,000 | $680,400 | $453,600 |
| 2023 | $16,951 | $1,373,326 | $823,996 | $549,330 |
| 2022 | $16,615 | $1,346,400 | $807,840 | $538,560 |
| 2021 | $13,084 | $1,039,256 | $519,628 | $519,628 |
| 2020 | $13,149 | $1,028,600 | $514,300 | $514,300 |
| 2019 | $12,703 | $1,008,432 | $504,216 | $504,216 |
| 2018 | $12,278 | $988,660 | $494,330 | $494,330 |
| 2017 | $11,836 | $969,276 | $484,638 | $484,638 |
| 2016 | $11,639 | $950,272 | $475,136 | $475,136 |
| 2015 | $10,219 | $835,056 | $417,528 | $417,528 |
| 2014 | $9,951 | $818,700 | $409,350 | $409,350 |
Source: Public Records
Map
Nearby Homes
- 5140 Diamond Heights Blvd Unit 203A
- 55 Red Rock Way Unit 207
- 5160 Diamond Heights Blvd Unit 107C
- 175 Red Rock Way Unit 101K
- 175 Red Rock Way Unit K204
- 175 Red Rock Way Unit 303K
- 5177 Diamond Heights Blvd Unit 113
- 5177 Diamond Heights Blvd Unit 114
- 5004 Diamond Heights Blvd Unit 2
- 838 Duncan St
- 49 High St
- 298 Portola Dr Unit 103
- 29 Cameo Way Unit 1
- 447 Hoffman Ave
- 724 27th St
- 126 Gold Mine Dr
- 930 Elizabeth St Unit 1
- 4258 26th St
- 212 Hoffman Ave
- 945 Corbett Ave Unit 206
- 5122 Diamond Heights Blvd Unit B
- 5122 Diamond Heights Blvd Unit A
- 5124 Diamond Heights Blvd Unit B
- 5124 Diamond Heights Blvd
- 5122A Diamond Heights Blvd Unit 2
- 5122B Diamond Heights Blvd
- 5118B Diamond Heights Blvd
- 5118A Diamond Heights Blvd
- 5114C Diamond Heights Blvd
- 5114B Diamond Heights Blvd Unit 2
- 5114A Diamond Heights Blvd Unit 44
- 5110A Diamond Heights Blvd
- 5110B Diamond Heights Blvd
- 5120 Diamond Heights Blvd
- 5114 Diamond Heights Blvd Unit B
- 5118 Diamond Heights Blvd
- 5118 Diamond Heights Blvd Unit A
- 5114 Diamond Heights Blvd Unit A
- 5110 Diamond Heights Blvd
- 5116 Diamond Heights Blvd Unit C