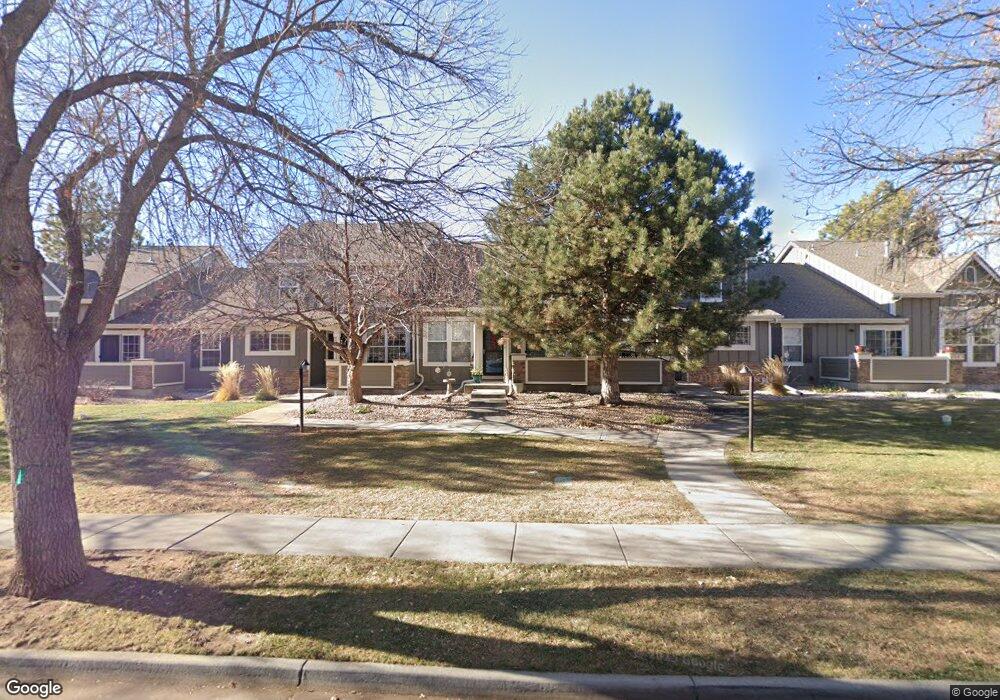
5125 Stetson Creek Ct Unit C Fort Collins, CO 80528
Estimated Value: $415,470 - $446,000
3
Beds
3
Baths
1,940
Sq Ft
$222/Sq Ft
Est. Value
About This Home
This home is located at 5125 Stetson Creek Ct Unit C, Fort Collins, CO 80528 and is currently estimated at $429,868, approximately $221 per square foot. 5125 Stetson Creek Ct Unit C is a home located in Larimer County with nearby schools including Kruse Elementary School, Preston Middle School, and Fossil Ridge High School.
Ownership History
Date
Name
Owned For
Owner Type
Purchase Details
Closed on
Jul 11, 2011
Sold by
Tynan Edward O and Tynan Julia M
Bought by
Ostergren Renee
Current Estimated Value
Home Financials for this Owner
Home Financials are based on the most recent Mortgage that was taken out on this home.
Original Mortgage
$133,200
Outstanding Balance
$91,810
Interest Rate
4.55%
Mortgage Type
New Conventional
Estimated Equity
$338,058
Purchase Details
Closed on
Mar 21, 2005
Sold by
Sisneros Julia M and Tynan Julia M
Bought by
Tynan Julia M
Purchase Details
Closed on
Oct 31, 2000
Sold by
Writer Corporation The
Bought by
Sisneros Julia M
Home Financials for this Owner
Home Financials are based on the most recent Mortgage that was taken out on this home.
Original Mortgage
$137,250
Interest Rate
7.87%
Create a Home Valuation Report for This Property
The Home Valuation Report is an in-depth analysis detailing your home's value as well as a comparison with similar homes in the area
Home Values in the Area
Average Home Value in this Area
Purchase History
| Date | Buyer | Sale Price | Title Company |
|---|---|---|---|
| Ostergren Renee | $195,000 | Land Title Guarantee Company | |
| Tynan Julia M | -- | -- | |
| Sisneros Julia M | $171,586 | Land Title Guarantee Company |
Source: Public Records
Mortgage History
| Date | Status | Borrower | Loan Amount |
|---|---|---|---|
| Open | Ostergren Renee | $133,200 | |
| Previous Owner | Sisneros Julia M | $137,250 |
Source: Public Records
Tax History Compared to Growth
Tax History
| Year | Tax Paid | Tax Assessment Tax Assessment Total Assessment is a certain percentage of the fair market value that is determined by local assessors to be the total taxable value of land and additions on the property. | Land | Improvement |
|---|---|---|---|---|
| 2025 | $2,460 | $29,326 | $2,680 | $26,646 |
| 2024 | $2,341 | $29,326 | $2,680 | $26,646 |
| 2022 | $2,269 | $24,026 | $2,780 | $21,246 |
| 2021 | $2,293 | $24,718 | $2,860 | $21,858 |
| 2020 | $2,384 | $25,475 | $2,860 | $22,615 |
| 2019 | $2,394 | $25,475 | $2,860 | $22,615 |
| 2018 | $1,887 | $20,700 | $2,880 | $17,820 |
| 2017 | $1,880 | $20,700 | $2,880 | $17,820 |
| 2016 | $1,618 | $17,719 | $3,184 | $14,535 |
| 2015 | $1,606 | $17,710 | $3,180 | $14,530 |
| 2014 | $1,321 | $14,480 | $3,180 | $11,300 |
Source: Public Records
Map
Nearby Homes
- 5121 Stillwater Creek Dr Unit B
- 2120 Timber Creek Dr Unit H4
- 2107 Stillwater Creek Dr
- 4913 Smallwood Ct
- 5225 White Willow Dr Unit F200
- 5225 White Willow Dr Unit J110
- 1919 Jamison Dr
- 2633 Rock Creek Dr
- 5609 Coppervein St
- 2602 Timberwood Dr Unit 2
- 2602 Timberwood Dr Unit 52
- 2021 Timberline Ln
- 2759 Harvest Park Ln
- 1638 Happy Woodland Dr
- 1702 Floating Leaf Dr
- 1626 Happy Woodland Dr
- 1708 Floating Leaf Dr
- 1726 Floating Leaf Dr
- 1608 Happy Woodland Dr
- HENNESSY Plan at Hansen Farm
- 5125 Stetson Creek Ct Unit A
- 5125 Stetson Creek Ct Unit B
- 5125 Stetson Creek Ct Unit E
- 5125 Stetson Creek Ct
- 2209 Copper Creek Dr Unit A
- 2209 Copper Creek Dr Unit B
- 2209 Copper Creek Dr Unit C
- 2209 Copper Creek Dr Unit D
- 2209 Copper Creek Dr
- 2218 Stetson Creek Dr Unit E
- 2218 Stetson Creek Dr Unit D
- 2218 Stetson Creek Dr Unit B
- 2218 Stetson Creek Dr Unit A
- 2218 Stetson Creek Dr
- 2208 Copper Creek Dr Unit A
- 2208 Copper Creek Dr Unit B
- 2208 Copper Creek Dr Unit C
- 2208 Copper Creek Dr Unit 28
- 5120 Stetson Creek Ct Unit 49
- 5120 Stetson Creek Ct Unit 48