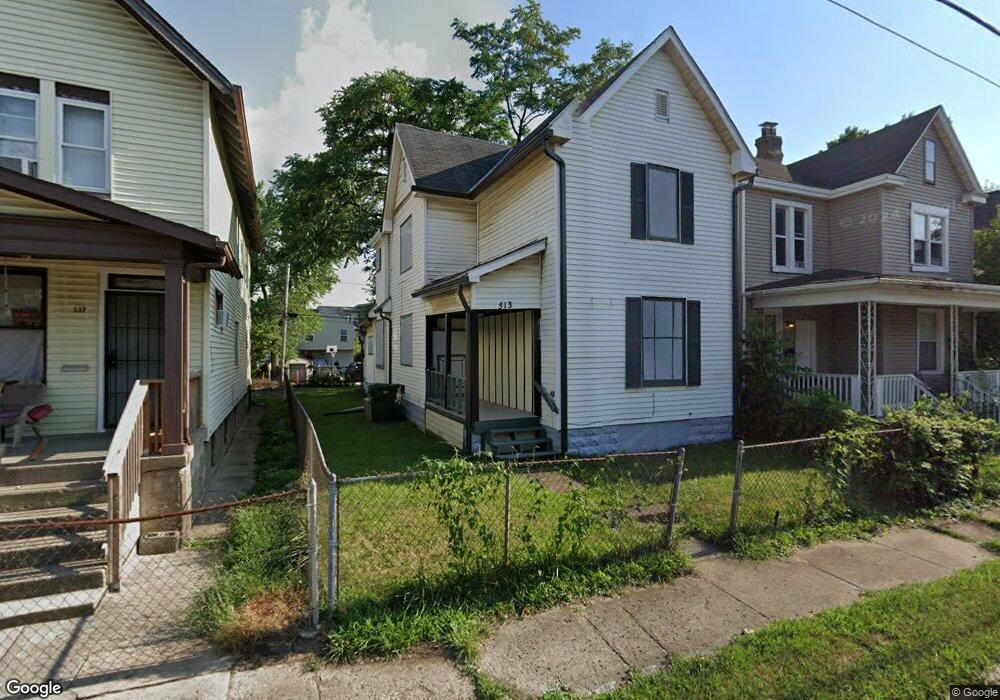
513 E 2nd Ave Columbus, OH 43201
Milo-Grogan NeighborhoodEstimated Value: $206,000 - $240,000
2
Beds
1
Bath
1,380
Sq Ft
$162/Sq Ft
Est. Value
About This Home
This home is located at 513 E 2nd Ave, Columbus, OH 43201 and is currently estimated at $223,190, approximately $161 per square foot. 513 E 2nd Ave is a home located in Franklin County with nearby schools including Weinland Park Elementary School, Dominion Middle School, and Whetstone High School.
Ownership History
Date
Name
Owned For
Owner Type
Purchase Details
Closed on
May 19, 2021
Sold by
639 East Second Avenue Llc
Bought by
513 East Second Llc
Current Estimated Value
Purchase Details
Closed on
May 10, 2012
Sold by
Vv Trust W Hommond
Bought by
639 East Second Avenue Llc
Purchase Details
Closed on
Apr 29, 2009
Sold by
Vv Family Trust
Bought by
Riffe Joshua David
Home Financials for this Owner
Home Financials are based on the most recent Mortgage that was taken out on this home.
Original Mortgage
$31,900
Interest Rate
4.84%
Mortgage Type
Seller Take Back
Purchase Details
Closed on
Nov 21, 2002
Sold by
Vance Vilma M
Bought by
Vv Trust
Home Financials for this Owner
Home Financials are based on the most recent Mortgage that was taken out on this home.
Original Mortgage
$30,000
Interest Rate
6.25%
Purchase Details
Closed on
Feb 6, 1992
Bought by
Vance Vilma M
Create a Home Valuation Report for This Property
The Home Valuation Report is an in-depth analysis detailing your home's value as well as a comparison with similar homes in the area
Home Values in the Area
Average Home Value in this Area
Purchase History
| Date | Buyer | Sale Price | Title Company |
|---|---|---|---|
| 513 East Second Llc | -- | None Available | |
| 639 East Second Avenue Llc | $41,900 | None Available | |
| Riffe Joshua David | $80,000 | None Available | |
| Vv Trust | $30,000 | -- | |
| Vance Vilma M | -- | -- |
Source: Public Records
Mortgage History
| Date | Status | Borrower | Loan Amount |
|---|---|---|---|
| Previous Owner | Riffe Joshua David | $31,900 | |
| Previous Owner | Vv Trust | $30,000 |
Source: Public Records
Tax History
| Year | Tax Paid | Tax Assessment Tax Assessment Total Assessment is a certain percentage of the fair market value that is determined by local assessors to be the total taxable value of land and additions on the property. | Land | Improvement |
|---|---|---|---|---|
| 2025 | $2,857 | $62,340 | $21,910 | $40,430 |
| 2024 | $2,857 | $62,340 | $21,910 | $40,430 |
| 2023 | $2,821 | $62,340 | $21,910 | $40,430 |
| 2022 | $1,196 | $22,510 | $3,850 | $18,660 |
| 2021 | $1,198 | $22,510 | $3,850 | $18,660 |
| 2020 | $1,200 | $22,510 | $3,850 | $18,660 |
| 2019 | $1,236 | $19,880 | $3,360 | $16,520 |
| 2018 | $1,071 | $19,880 | $3,360 | $16,520 |
| 2017 | $1,116 | $19,880 | $3,360 | $16,520 |
| 2016 | $997 | $14,670 | $1,650 | $13,020 |
| 2015 | $907 | $14,670 | $1,650 | $13,020 |
| 2014 | $910 | $14,670 | $1,650 | $13,020 |
| 2013 | $523 | $14,665 | $1,645 | $13,020 |
Source: Public Records
Map
Nearby Homes
- 472 Reynolds Ave Unit 474
- 663 E 2nd Ave
- 650 E 3rd Ave
- 276 E 4th Ave
- 719 Civitas Ave Unit 401
- 292 Dickinson St
- 705 Civitas Ave Unit 201
- 268 Neruda Ave
- 290 Dickinson St
- 274 Cornelius St
- 695 Civitas Ave Unit 301
- 773-775 E 3rd Ave
- 239 Auden Ave
- 276 Dickenson St
- 975 N 6th St
- 278 Dickenson St
- 971 N 6th St
- 280 Dickenson St
- 282 Dickenson St
- 284 Dickenson St
- 517 E 2nd Ave Unit 519
- 509 E 2nd Ave
- 505 E 2nd Ave
- 499-501 E 2nd Ave
- 499 E 2nd Ave
- 508 Reynolds Ave
- 504 Reynolds Ave
- 512 Reynolds Ave
- 498 Reynolds Ave Unit 500
- 516 Reynolds Ave
- 496 Reynolds Ave
- 520 Reynolds Ave
- 493 E 2nd Ave
- 514 E 2nd Ave
- 492 Reynolds Ave
- 520 E 2nd Ave
- 512 E 2nd Ave
- 522 E 2nd Ave
- 508 E 2nd Ave
- 502 E 2nd Ave
Your Personal Tour Guide
Ask me questions while you tour the home.