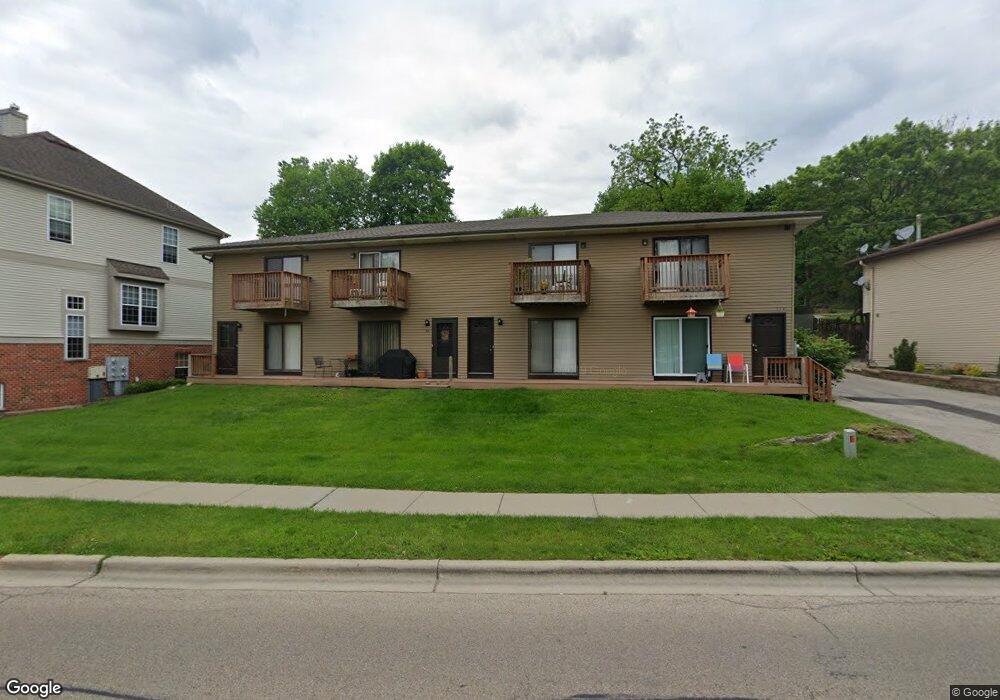
514 N Harrison St Algonquin, IL 60102
Estimated Value: $509,000 - $629,000
Studio
--
Bath
4,736
Sq Ft
$122/Sq Ft
Est. Value
About This Home
This home is located at 514 N Harrison St, Algonquin, IL 60102 and is currently estimated at $576,868, approximately $121 per square foot. 514 N Harrison St is a home located in McHenry County with nearby schools including Eastview Elementary School, Algonquin Middle School, and Dundee-Crown High School.
Ownership History
Date
Name
Owned For
Owner Type
Purchase Details
Closed on
Jun 24, 2024
Sold by
Poincelet Anne-Marie
Bought by
Amp Props Llc Harrison
Current Estimated Value
Purchase Details
Closed on
Jan 9, 2020
Sold by
Poincelet Anne Marie and The Pamela J Poincelet Trust N
Bought by
Poincelet Ann Marie
Purchase Details
Closed on
Dec 21, 2016
Sold by
Poincelet Anne Marie
Bought by
Poincelet Anne Marie
Purchase Details
Closed on
Oct 26, 2010
Sold by
Poincelet Pamela J
Bought by
Pamela J Poincelet Trust #1
Purchase Details
Closed on
Mar 24, 1999
Sold by
Weck Daniel E and Weck Carlene A
Bought by
Poincelet Pamela
Home Financials for this Owner
Home Financials are based on the most recent Mortgage that was taken out on this home.
Original Mortgage
$196,700
Interest Rate
6.89%
Create a Home Valuation Report for This Property
The Home Valuation Report is an in-depth analysis detailing your home's value as well as a comparison with similar homes in the area
Purchase History
| Date | Buyer | Sale Price | Title Company |
|---|---|---|---|
| Amp Props Llc Harrison | -- | Mgr Title Services | |
| Ppt Props Llc Harrison | -- | Mgr Title Services | |
| Poincelet Ann Marie | -- | None Available | |
| Poincelet Anne Marie | -- | Attorney | |
| Pamela J Poincelet Trust #1 | -- | None Available | |
| Poincelet Pamela | $281,000 | Chicago Title Insurance Co |
Source: Public Records
Mortgage History
| Date | Status | Borrower | Loan Amount |
|---|---|---|---|
| Previous Owner | Poincelet Pamela | $196,700 |
Source: Public Records
Tax History
| Year | Tax Paid | Tax Assessment Tax Assessment Total Assessment is a certain percentage of the fair market value that is determined by local assessors to be the total taxable value of land and additions on the property. | Land | Improvement |
|---|---|---|---|---|
| 2024 | $13,950 | $178,325 | $31,365 | $146,960 |
| 2023 | $13,351 | $159,489 | $28,052 | $131,437 |
| 2022 | $12,344 | $143,943 | $25,318 | $118,625 |
| 2021 | $11,899 | $134,100 | $23,587 | $110,513 |
| 2020 | $11,615 | $129,353 | $22,752 | $106,601 |
| 2019 | $11,368 | $123,806 | $21,776 | $102,030 |
| 2018 | $10,901 | $114,370 | $20,116 | $94,254 |
| 2017 | $10,729 | $107,744 | $18,951 | $88,793 |
| 2016 | $10,627 | $101,054 | $17,774 | $83,280 |
| 2013 | -- | $85,302 | $16,581 | $68,721 |
Source: Public Records
Map
Nearby Homes
- 0 River Dr N Unit MRD12473279
- 720 Ash St
- 600 E Algonquin Rd
- 407 La Fox River Dr
- 953 Old Oak Cir
- 1188 E Algonquin Rd
- 719 Webster St
- 1302 Cary Rd
- 1439 Lowe Dr
- lot 021 Route 31 Hwy
- 1031 Timberwood Ln
- 730 Chestnut Ct
- 721 Brentwood Ct
- 615 Harper Dr
- 1625 Powder Horn Dr
- 966 Mesa Dr
- 1730 Tanglewood Dr
- 935 Viewpoint Dr
- Lot 4 b Ryan Pkwy
- 1770 E Algonquin Rd
- 514 N Harrison St Unit A
- 514 N Harrison St Unit D
- 440 N Harrison St
- 436 N Harrison St
- 518 N Harrison St Unit A
- 518 N Harrison St Unit D
- 518 N Harrison St Unit B
- 518 N Harrison St Unit C
- 432 N Harrison St
- 428 N Harrison St
- 423 N Main St
- 515 N Harrison St
- 517 N Harrison St
- 424 N Harrison St
- 503 N Main St
- 415 N Main St Unit 417
- 405 N Harrison St
- 520 N Harrison St
- 417 N Main St
- 416 N Harrison St