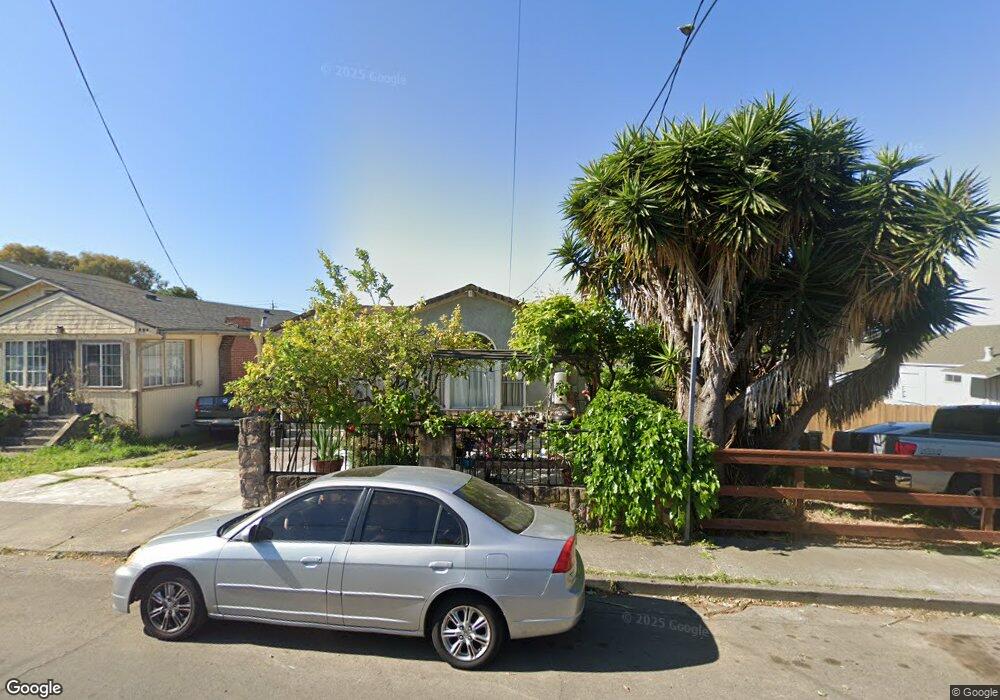
515 Cypress Ave Vallejo, CA 94590
West Vallejo NeighborhoodEstimated Value: $443,642 - $486,000
3
Beds
2
Baths
1,378
Sq Ft
$334/Sq Ft
Est. Value
About This Home
This home is located at 515 Cypress Ave, Vallejo, CA 94590 and is currently estimated at $459,911, approximately $333 per square foot. 515 Cypress Ave is a home located in Solano County with nearby schools including Grace Patterson Elementary School, Vallejo High School, and Mustard Seed Preschool and Kindergarten.
Ownership History
Date
Name
Owned For
Owner Type
Purchase Details
Closed on
Jul 15, 2021
Sold by
Perez Maria Estela
Bought by
Perez Maria Estela and The Maria Estela Perez Revocab
Current Estimated Value
Purchase Details
Closed on
Jan 30, 2017
Sold by
Perez Luis and Perez Maria Estella
Bought by
Perez Luis and Perez Maria Estella
Purchase Details
Closed on
Feb 19, 2004
Sold by
Perez Luis and Perez Maria
Bought by
Perez Jose Luis and Perez Maria Estella
Home Financials for this Owner
Home Financials are based on the most recent Mortgage that was taken out on this home.
Original Mortgage
$60,000
Outstanding Balance
$27,729
Interest Rate
5.62%
Mortgage Type
Credit Line Revolving
Estimated Equity
$432,182
Purchase Details
Closed on
Jun 10, 1994
Sold by
Perez Luis and Perez Jose Louis
Bought by
Perez Luis and Perez Maria
Home Financials for this Owner
Home Financials are based on the most recent Mortgage that was taken out on this home.
Original Mortgage
$112,800
Interest Rate
6.5%
Create a Home Valuation Report for This Property
The Home Valuation Report is an in-depth analysis detailing your home's value as well as a comparison with similar homes in the area
Home Values in the Area
Average Home Value in this Area
Purchase History
| Date | Buyer | Sale Price | Title Company |
|---|---|---|---|
| Perez Maria Estela | -- | None Available | |
| Perez Maria Estela | -- | None Available | |
| Perez Luis | -- | None Available | |
| Perez Jose Luis | -- | Chicago Title Co | |
| Perez Luis | -- | -- |
Source: Public Records
Mortgage History
| Date | Status | Borrower | Loan Amount |
|---|---|---|---|
| Open | Perez Jose Luis | $60,000 | |
| Closed | Perez Luis | $112,800 |
Source: Public Records
Tax History
| Year | Tax Paid | Tax Assessment Tax Assessment Total Assessment is a certain percentage of the fair market value that is determined by local assessors to be the total taxable value of land and additions on the property. | Land | Improvement |
|---|---|---|---|---|
| 2025 | $3,640 | $233,412 | $61,886 | $171,526 |
| 2024 | $3,640 | $228,836 | $60,673 | $168,163 |
| 2023 | $3,410 | $224,350 | $59,484 | $164,866 |
| 2022 | $3,308 | $219,952 | $58,318 | $161,634 |
| 2021 | $3,233 | $215,640 | $57,175 | $158,465 |
| 2020 | $3,237 | $213,430 | $56,589 | $156,841 |
| 2019 | $3,129 | $209,246 | $55,480 | $153,766 |
| 2018 | $2,922 | $205,144 | $54,393 | $150,751 |
| 2017 | $2,797 | $201,123 | $53,327 | $147,796 |
| 2016 | $2,290 | $197,181 | $52,282 | $144,899 |
| 2015 | $2,260 | $194,220 | $51,497 | $142,723 |
| 2014 | $2,229 | $190,417 | $50,489 | $139,928 |
Source: Public Records
Map
Nearby Homes
Your Personal Tour Guide
Ask me questions while you tour the home.