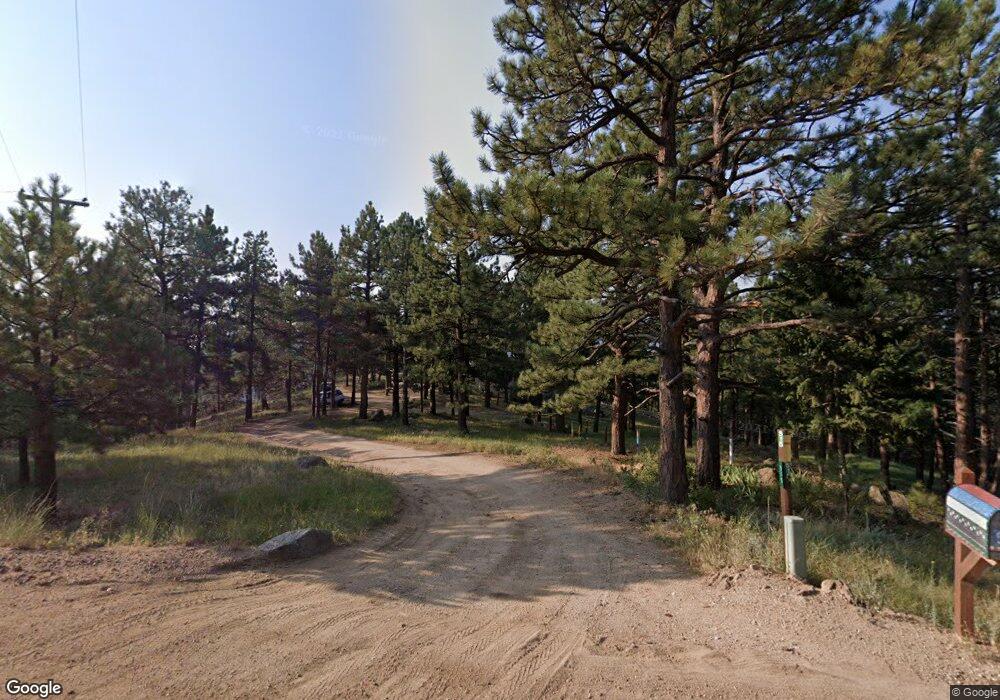
515 Poorman Rd Boulder, CO 80302
Seven Hills NeighborhoodEstimated Value: $1,026,769 - $1,877,000
3
Beds
2
Baths
1,375
Sq Ft
$1,010/Sq Ft
Est. Value
About This Home
This home is located at 515 Poorman Rd, Boulder, CO 80302 and is currently estimated at $1,388,442, approximately $1,009 per square foot. 515 Poorman Rd is a home located in Boulder County with nearby schools including Flatirons Elementary School, Casey Middle School, and Boulder High School.
Ownership History
Date
Name
Owned For
Owner Type
Purchase Details
Closed on
Mar 16, 2020
Sold by
Perlick David A and Perlick Jennifer B
Bought by
Jennifer B Perlick Revocable Trust
Current Estimated Value
Purchase Details
Closed on
Sep 25, 2015
Sold by
Jennifer B Perlick Revocable Trust
Bought by
Perlick David A
Home Financials for this Owner
Home Financials are based on the most recent Mortgage that was taken out on this home.
Original Mortgage
$308,000
Outstanding Balance
$3,104
Interest Rate
3.97%
Mortgage Type
New Conventional
Estimated Equity
$1,385,338
Purchase Details
Closed on
Nov 1, 2013
Sold by
Perlick Jennifer B and Perlick David A
Bought by
Jennifer B Perlick Revocable Trust
Purchase Details
Closed on
Jan 8, 2013
Sold by
Perlick David A and Perlick Jennifer B
Bought by
Jennifer B Perlick Revocable Trust
Purchase Details
Closed on
Nov 5, 2010
Sold by
Jennifer B Perlick Revocable Trust
Bought by
Perlick Jennifer B
Home Financials for this Owner
Home Financials are based on the most recent Mortgage that was taken out on this home.
Original Mortgage
$329,000
Interest Rate
4.32%
Mortgage Type
New Conventional
Purchase Details
Closed on
Apr 23, 2010
Sold by
Perlick David A and Perlick Jennifer B
Bought by
Jennifer B Perlick Revocable Trust
Purchase Details
Closed on
Aug 6, 2003
Sold by
Larson Dawn E and Estate Of James P Graves
Bought by
Perlick David A and Perlick Jennifer B
Home Financials for this Owner
Home Financials are based on the most recent Mortgage that was taken out on this home.
Original Mortgage
$322,700
Interest Rate
5.24%
Mortgage Type
Purchase Money Mortgage
Purchase Details
Closed on
Nov 7, 1979
Bought by
Perlick Jennifer B and Perlick David A
Purchase Details
Closed on
Oct 9, 1975
Bought by
Perlick Jennifer B and Perlick David A
Create a Home Valuation Report for This Property
The Home Valuation Report is an in-depth analysis detailing your home's value as well as a comparison with similar homes in the area
Home Values in the Area
Average Home Value in this Area
Purchase History
| Date | Buyer | Sale Price | Title Company |
|---|---|---|---|
| Jennifer B Perlick Revocable Trust | -- | None Available | |
| Perlick David A | -- | First American Title Ins Co | |
| Jennifer B Perlick Revocable Trust | -- | First American | |
| Perlick Jenniferb | -- | First American | |
| Jennifer B Perlick Revocable Trust | -- | None Available | |
| Perlick Jennifer B | -- | First Colorado Title | |
| Jennifer B Perlick Revocable Trust | -- | None Available | |
| Perlick David A | $580,000 | Land Title | |
| Perlick Jennifer B | -- | -- | |
| Perlick Jennifer B | $70,000 | -- |
Source: Public Records
Mortgage History
| Date | Status | Borrower | Loan Amount |
|---|---|---|---|
| Open | Perlick David A | $308,000 | |
| Previous Owner | Perlick Jennifer B | $329,000 | |
| Previous Owner | Perlick David A | $322,700 | |
| Closed | Perlick David A | $67,300 |
Source: Public Records
Tax History
| Year | Tax Paid | Tax Assessment Tax Assessment Total Assessment is a certain percentage of the fair market value that is determined by local assessors to be the total taxable value of land and additions on the property. | Land | Improvement |
|---|---|---|---|---|
| 2025 | $7,413 | $69,531 | $48,681 | $20,850 |
| 2024 | $7,413 | $69,531 | $48,681 | $20,850 |
| 2023 | $7,297 | $76,320 | $49,493 | $30,512 |
| 2022 | $5,856 | $57,351 | $40,414 | $16,937 |
| 2021 | $5,605 | $59,002 | $41,577 | $17,425 |
| 2020 | $5,095 | $53,096 | $28,171 | $24,925 |
| 2019 | $5,025 | $53,096 | $28,171 | $24,925 |
| 2018 | $4,870 | $50,839 | $25,344 | $25,495 |
| 2017 | $4,744 | $56,205 | $28,019 | $28,186 |
| 2016 | $4,476 | $52,640 | $28,895 | $23,745 |
| 2015 | $4,234 | $43,899 | $9,313 | $34,586 |
| 2014 | $3,703 | $43,899 | $9,313 | $34,586 |
Source: Public Records
Map
Nearby Homes
- 2050 Fourmile Canyon Dr
- 148 Granite Dr
- 907 Fourmile Canyon Dr
- 65 Bristlecone Way Unit 7
- 335 Pine Tree Ln
- 1530 Timber Ln
- 1138 Timber Ln
- 1145 Timber Ln Unit 3
- 1151 Timber Ln
- 375 Arroyo Chico
- 2554 Linden Dr
- 807 Timber Ln
- 470 Weaver Dr
- 1327 Weaver Dr
- 2857 Linden Dr
- 2990 Linden Dr
- 1575 Linden Dr
- 1573 Linden Dr
- 50 Wildwood Ln
- 495 S Cedar Brook Rd
- 651 Poorman Rd
- 16 Leonards Rd
- 345 Poorman Rd
- 22 Old Sunshine Trail
- 815 Poorman Rd
- 121 Leonards Rd
- 102 Goatbarn Ln
- 684 Poorman Rd
- 758 Poorman Rd
- 2889 Sunshine Canyon Dr
- 100 Old Sunshine Trail
- 153 Poorman Rd
- 2891 Sunshine Canyon Dr
- 149 Poorman Rd
- 195 Leonards Rd
- 825 Poorman Rd
- 108 Goatbarn Ln
- 141 Poorman Rd
- 14 Model T Rd
- 135 Poorman Rd
Your Personal Tour Guide
Ask me questions while you tour the home.