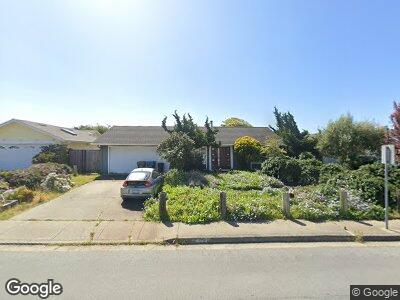
515 Spindrift Way Half Moon Bay, CA 94019
Estimated Value: $1,047,000 - $1,224,000
2
Beds
1
Bath
810
Sq Ft
$1,416/Sq Ft
Est. Value
About This Home
This home is located at 515 Spindrift Way, Half Moon Bay, CA 94019 and is currently estimated at $1,146,984, approximately $1,416 per square foot. 515 Spindrift Way is a home located in San Mateo County with nearby schools including El Granada Elementary School, Manuel F. Cunha Intermediate School, and Half Moon Bay High School.
Ownership History
Date
Name
Owned For
Owner Type
Purchase Details
Closed on
Jan 3, 2023
Sold by
Locke David John and Locke Sarah Therese
Bought by
Locke Harkness Living Trust
Current Estimated Value
Purchase Details
Closed on
Sep 5, 2014
Sold by
Locke David John
Bought by
Locke David John and Harkness Sarah Theresa
Home Financials for this Owner
Home Financials are based on the most recent Mortgage that was taken out on this home.
Original Mortgage
$488,000
Interest Rate
4.2%
Mortgage Type
New Conventional
Purchase Details
Closed on
Oct 14, 2009
Sold by
Wehjte Neal
Bought by
Locke David John
Home Financials for this Owner
Home Financials are based on the most recent Mortgage that was taken out on this home.
Original Mortgage
$88,612
Interest Rate
5.05%
Mortgage Type
Stand Alone Second
Create a Home Valuation Report for This Property
The Home Valuation Report is an in-depth analysis detailing your home's value as well as a comparison with similar homes in the area
Home Values in the Area
Average Home Value in this Area
Purchase History
| Date | Buyer | Sale Price | Title Company |
|---|---|---|---|
| Locke Harkness Living Trust | -- | -- | |
| Locke David John | -- | Stewart Title Guaranty | |
| Locke David John | $521,500 | First American Title Company |
Source: Public Records
Mortgage History
| Date | Status | Borrower | Loan Amount |
|---|---|---|---|
| Previous Owner | Locke David John | $488,000 | |
| Previous Owner | Locke David John | $88,612 | |
| Previous Owner | Locke David John | $417,000 | |
| Previous Owner | Wehtje Neal | $250,000 | |
| Previous Owner | Wehtje Neal | $70,000 |
Source: Public Records
Tax History Compared to Growth
Tax History
| Year | Tax Paid | Tax Assessment Tax Assessment Total Assessment is a certain percentage of the fair market value that is determined by local assessors to be the total taxable value of land and additions on the property. | Land | Improvement |
|---|---|---|---|---|
| 2023 | $8,793 | $647,012 | $323,506 | $323,506 |
| 2022 | $8,179 | $634,326 | $317,163 | $317,163 |
| 2021 | $7,928 | $621,890 | $310,945 | $310,945 |
| 2020 | $7,820 | $615,514 | $307,757 | $307,757 |
| 2019 | $7,613 | $603,446 | $301,723 | $301,723 |
| 2018 | $7,191 | $591,614 | $295,807 | $295,807 |
| 2017 | $7,088 | $580,014 | $290,007 | $290,007 |
| 2016 | $7,002 | $568,642 | $284,321 | $284,321 |
| 2015 | $6,866 | $560,102 | $280,051 | $280,051 |
| 2014 | $6,762 | $549,132 | $274,566 | $274,566 |
Source: Public Records
Map
Nearby Homes
- 1490 Cabrillo Hwy N
- 2013 Avignon Place
- 624 Terrace Ave
- 456 Grand Blvd
- 0 Upper Terrace Ave
- 411 Belleville Blvd
- 2786 Pullman Ave
- 840 Frenchmans Creek Rd
- 466 Willow Ave
- 470 Willow Ave
- 402 Laurel Ave
- 408 Roosevelt Blvd
- 460 Pine Ave Unit 46
- 170 Miramontes Ave
- 10 Patrick Way
- 43 Patrick Way
- 65 Patrick Way
- 315 Valdez Ave
- 628 Alsace Loraine Ave
- 23 Erin Ln
- 515 Spindrift Way
- 511 Spindrift Way
- 519 Spindrift Way
- 507 Spindrift Way
- 523 Spindrift Way
- 1501 Spinnaker Ln
- 518 Spindrift Way
- 527 Spindrift Way
- 503 Spindrift Way
- 522 Spindrift Way
- 1504 Spinnaker Ln
- 1502 Spinnaker Ln
- 526 Spindrift Way
- 531 Spindrift Way
- 1506 Spinnaker Ln
- 1503 Spinnaker Ln
- 530 Spindrift Way
- 1508 Spinnaker Ln
- 100 Tiller Ct
- 1505 Spinnaker Ln