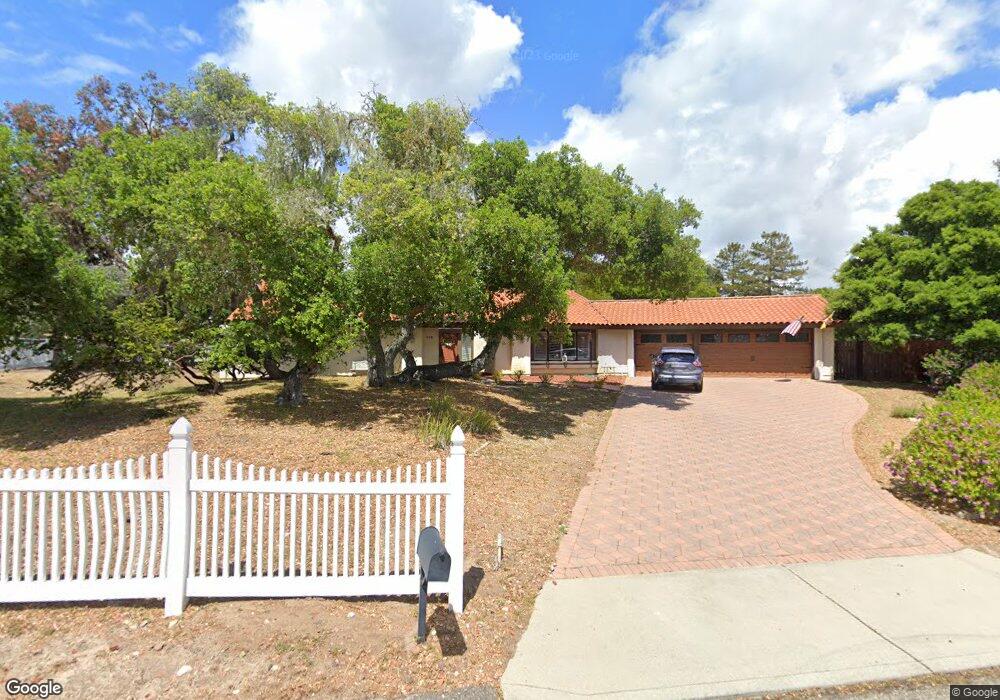
515 Tamarack Ct Unit 2 Lompoc, CA 93436
Estimated Value: $735,000 - $1,050,000
4
Beds
2
Baths
2,379
Sq Ft
$374/Sq Ft
Est. Value
About This Home
This home is located at 515 Tamarack Ct Unit 2, Lompoc, CA 93436 and is currently estimated at $888,877, approximately $373 per square foot. 515 Tamarack Ct Unit 2 is a home located in Santa Barbara County with nearby schools including Buena Vista Elementary School and Cabrillo High School.
Ownership History
Date
Name
Owned For
Owner Type
Purchase Details
Closed on
Jan 18, 2021
Sold by
Rehkopf Lynette
Bought by
Rehkopf Lynette and The Lynette Rehkopf Trust
Current Estimated Value
Purchase Details
Closed on
Oct 14, 2019
Sold by
Rehkopf Donald and The L & O Mazug Family Trust
Bought by
Rehkopf Donald and Rehkopf Lynette
Purchase Details
Closed on
Jun 29, 1999
Sold by
Mazug Leslie J and Mazug Olive F
Bought by
Mazug Leslie J and Mazug Olive F
Purchase Details
Closed on
Jul 1, 1998
Sold by
Mazug Leslie J and Mazug Olive F
Bought by
Mazug Leslie J and Mazug Olive F
Purchase Details
Closed on
Mar 11, 1997
Sold by
Burdeno P L and Burdeno Penelope Perdue
Bought by
Mazug Leslie J and Mazug Olive F
Home Financials for this Owner
Home Financials are based on the most recent Mortgage that was taken out on this home.
Original Mortgage
$80,000
Interest Rate
7.96%
Create a Home Valuation Report for This Property
The Home Valuation Report is an in-depth analysis detailing your home's value as well as a comparison with similar homes in the area
Home Values in the Area
Average Home Value in this Area
Purchase History
| Date | Buyer | Sale Price | Title Company |
|---|---|---|---|
| Rehkopf Lynette | -- | None Available | |
| Rehkopf Donald | $300,000 | None Available | |
| Mazug Leslie J | -- | -- | |
| Mazug Leslie J | -- | -- | |
| Mazug Leslie J | -- | -- | |
| Mazug Leslie J | $275,000 | First American Title |
Source: Public Records
Mortgage History
| Date | Status | Borrower | Loan Amount |
|---|---|---|---|
| Previous Owner | Mazug Leslie J | $80,000 |
Source: Public Records
Tax History
| Year | Tax Paid | Tax Assessment Tax Assessment Total Assessment is a certain percentage of the fair market value that is determined by local assessors to be the total taxable value of land and additions on the property. | Land | Improvement |
|---|---|---|---|---|
| 2025 | $6,322 | $552,286 | $246,067 | $306,219 |
| 2023 | $6,322 | $530,842 | $236,513 | $294,329 |
| 2022 | $6,222 | $520,434 | $231,876 | $288,558 |
| 2021 | $6,291 | $510,230 | $227,330 | $282,900 |
| 2020 | $6,227 | $505,000 | $225,000 | $280,000 |
| 2019 | $4,962 | $401,492 | $145,994 | $255,498 |
| 2018 | $4,890 | $393,621 | $143,132 | $250,489 |
| 2017 | $4,716 | $385,904 | $140,326 | $245,578 |
| 2016 | $4,364 | $378,338 | $137,575 | $240,763 |
| 2015 | $4,331 | $372,656 | $135,509 | $237,147 |
| 2014 | -- | $365,357 | $132,855 | $232,502 |
Source: Public Records
Map
Nearby Homes
- 649 Burning Tree Way
- 0 Oak Hill Dr Unit 24-783
- 372 Oak Hill Dr
- 240 Oak Hill Dr
- 73 Stanford Cir
- 250 Saint Andrews Way
- 106 Galaxy Way Unit 3
- 113 Gemini Ave
- 232 Vega Ave
- 1445 Calle Marana
- 3939 Mesa Circle Dr
- 3916 Mesa Circle Dr Unit A
- 3660 Rucker Rd
- 3725 Jupiter Ave
- 3578 Via Lato
- 758 Voyager Rd
- 972 Pellham Dr
- 1141 Pellham Dr
- 832 Onstott Rd
- 892 Onstott Rd
- 535 Tamarack Ct Unit 2
- 718 Saint Andrews Way
- 527 Tamarack Ct
- 717 Saint Andrews Way Unit 2
- 716 Saint Andrews Way Unit 2
- 485 Firestone Way
- 714 Saint Andrews Way
- 463 Firestone Way
- 712 Saint Andrews Way Unit 2
- 709 Cypress Way Unit 2
- 711 Saint Andrews Way Unit 2
- 480 Firestone Way
- 710 Saint Andrews Way
- 456 Firestone Way
- 709 Saint Andrews Way Unit 2
- 449 Firestone Way
- 712 Cypress Way
- 706 Saint Andrews Way
Your Personal Tour Guide
Ask me questions while you tour the home.