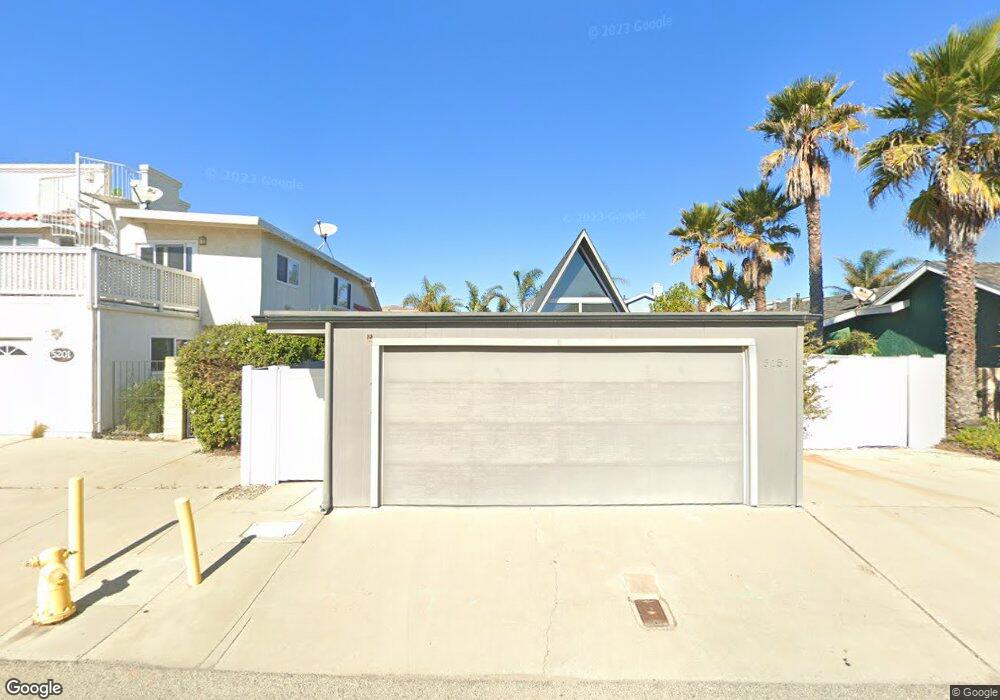
5151 Wavecrest Way Oxnard, CA 93035
Oxnard Shores NeighborhoodEstimated Value: $1,165,000 - $1,211,000
3
Beds
2
Baths
1,480
Sq Ft
$802/Sq Ft
Est. Value
About This Home
This home is located at 5151 Wavecrest Way, Oxnard, CA 93035 and is currently estimated at $1,187,119, approximately $802 per square foot. 5151 Wavecrest Way is a home located in Ventura County with nearby schools including Christa Mcauliffe Elementary School and Oxnard High School.
Ownership History
Date
Name
Owned For
Owner Type
Purchase Details
Closed on
Feb 9, 2012
Sold by
Rosenblit Steven H and Keller Cynthia A
Bought by
Rosenblit Steven H and Keller Cynthia Ann
Current Estimated Value
Home Financials for this Owner
Home Financials are based on the most recent Mortgage that was taken out on this home.
Original Mortgage
$255,000
Outstanding Balance
$174,450
Interest Rate
3.86%
Mortgage Type
New Conventional
Estimated Equity
$1,012,669
Purchase Details
Closed on
Sep 19, 2011
Sold by
Rosenblit Steven H and Keller Cynthia A
Bought by
Rosenblit Steven H and Keller Cynthia Ann
Purchase Details
Closed on
Mar 7, 2011
Sold by
U S Bank National Association
Bought by
Rosenblit Steven H and Keller Cynthia A
Home Financials for this Owner
Home Financials are based on the most recent Mortgage that was taken out on this home.
Original Mortgage
$260,000
Interest Rate
4.77%
Mortgage Type
New Conventional
Purchase Details
Closed on
Oct 21, 2010
Sold by
David Jose C and David Lori A
Bought by
U S Bank National Association
Purchase Details
Closed on
Dec 4, 2008
Sold by
David Jose C and David Lori A
Bought by
David Jose C and David Lori A
Purchase Details
Closed on
Mar 28, 2005
Sold by
Davis Jose C and David Lori A
Bought by
David Jose C and David Lori A
Purchase Details
Closed on
May 23, 2003
Sold by
David Jose C and David Lori A
Bought by
David Jose C and David Lori A
Home Financials for this Owner
Home Financials are based on the most recent Mortgage that was taken out on this home.
Original Mortgage
$242,000
Interest Rate
5.75%
Mortgage Type
Purchase Money Mortgage
Purchase Details
Closed on
Aug 12, 2002
Sold by
David Jose C and David Lori A
Bought by
David Jose C and David Lori A
Purchase Details
Closed on
Jul 21, 1999
Sold by
Breon Mitch Nancy L
Bought by
David Jose C and David Lori A
Home Financials for this Owner
Home Financials are based on the most recent Mortgage that was taken out on this home.
Original Mortgage
$217,600
Interest Rate
6.75%
Create a Home Valuation Report for This Property
The Home Valuation Report is an in-depth analysis detailing your home's value as well as a comparison with similar homes in the area
Home Values in the Area
Average Home Value in this Area
Purchase History
| Date | Buyer | Sale Price | Title Company |
|---|---|---|---|
| Rosenblit Steven H | -- | First American Title Company | |
| Rosenblit Steven H | -- | First American Title Company | |
| Rosenblit Steven H | -- | None Available | |
| Rosenblit Steven H | $360,000 | Lawyers Title | |
| U S Bank National Association | $548,105 | Accommodation | |
| David Jose C | -- | None Available | |
| David Jose C | -- | -- | |
| David Jose C | -- | Gateway Title Company | |
| David Jose C | -- | Lawyers Title Company | |
| David Jose C | $272,000 | Chicago Title Co |
Source: Public Records
Mortgage History
| Date | Status | Borrower | Loan Amount |
|---|---|---|---|
| Open | Rosenblit Steven H | $255,000 | |
| Closed | Rosenblit Steven H | $260,000 | |
| Previous Owner | David Jose C | $242,000 | |
| Previous Owner | David Jose C | $217,600 | |
| Closed | David Jose C | $27,200 |
Source: Public Records
Tax History
| Year | Tax Paid | Tax Assessment Tax Assessment Total Assessment is a certain percentage of the fair market value that is determined by local assessors to be the total taxable value of land and additions on the property. | Land | Improvement |
|---|---|---|---|---|
| 2025 | $5,600 | $461,210 | $313,884 | $147,326 |
| 2024 | $5,600 | $452,167 | $307,729 | $144,438 |
| 2023 | $5,395 | $443,301 | $301,695 | $141,606 |
| 2022 | $5,233 | $434,609 | $295,779 | $138,830 |
| 2021 | $5,191 | $426,088 | $289,980 | $136,108 |
| 2020 | $5,288 | $421,720 | $287,007 | $134,713 |
| 2019 | $5,139 | $413,452 | $281,380 | $132,072 |
| 2018 | $5,067 | $405,346 | $275,863 | $129,483 |
| 2017 | $4,809 | $397,399 | $270,454 | $126,945 |
| 2016 | $4,641 | $389,607 | $265,151 | $124,456 |
| 2015 | $4,690 | $383,757 | $261,169 | $122,588 |
| 2014 | $4,638 | $376,242 | $256,054 | $120,188 |
Source: Public Records
Map
Nearby Homes
- 5120 Seabreeze Way
- 5244 Whitecap St
- 5124 Beachcomber St
- 5121 Breakwater Way
- 5125 W Wooley Rd Unit 5
- 1000 Mandalay Beach Rd
- 4941 Catamaran St
- 5120 Terramar Way
- 4901 Catamaran St
- 1095 Canal St
- 5202 Driftwood St
- 1135 Capri Way
- 4906 Dunes St
- 920 Catamaran St
- 1230 Mandalay Beach Rd
- 5442 Driftwood St
- 815 Mandalay Beach Rd
- 1251 Mandalay Beach Rd
- 1068 Canal St
- 711 Mandalay Beach Rd
- 5145 Wavecrest Way
- 5201 Wavecrest Way
- 5205 Wavecrest Way
- 5150 Seabreeze Way
- 5144 Seabreeze Way
- 5200 Seabreeze Way
- 5209 Wavecrest Way
- 5153 Whitecap St
- 5145 Whitecap St
- 5140 Seabreeze Way
- 5204 Seabreeze Way
- 5140 Seabreeze Way
- 5143 Whitecap St
- 5207 Whitecap St
- 5215 Wavecrest Way
- 5134 Seabreeze Way
- 5131 Wavecrest Way
- 5210 Seabreeze Way
- 5137 Whitecap St
Your Personal Tour Guide
Ask me questions while you tour the home.