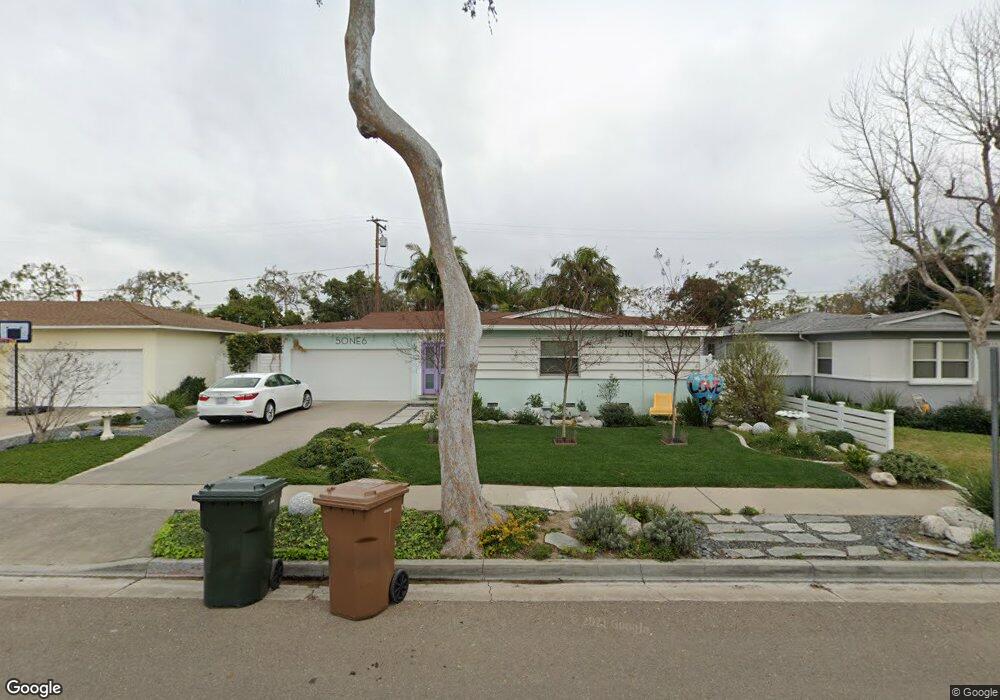
516 Princeton Cir E Fullerton, CA 92831
Lower Raymond Hills NeighborhoodEstimated Value: $953,863 - $1,043,000
3
Beds
2
Baths
1,316
Sq Ft
$755/Sq Ft
Est. Value
About This Home
This home is located at 516 Princeton Cir E, Fullerton, CA 92831 and is currently estimated at $992,966, approximately $754 per square foot. 516 Princeton Cir E is a home located in Orange County with nearby schools including Raymond Elementary School, Ladera Vista Junior High School, and Fullerton Union High School.
Ownership History
Date
Name
Owned For
Owner Type
Purchase Details
Closed on
Feb 18, 2026
Sold by
Lloyd-Davies Wendy
Bought by
Torres And Davies Family Trust and Torres
Current Estimated Value
Purchase Details
Closed on
Mar 22, 1999
Sold by
Torres Brian
Bought by
Lloyd Davies Wendy
Purchase Details
Closed on
Dec 14, 1998
Sold by
Lloyd Davies Jack Hastings and Lloyd Davies Lucy
Bought by
Lloyd Davies Wendy
Purchase Details
Closed on
Feb 21, 1997
Sold by
Lester Post
Bought by
Lloyd Davies Jack Hastings and Lloyd Davies Lucy
Purchase Details
Closed on
May 7, 1996
Sold by
Post Lester and Post Anne C
Bought by
Post Lester and The Lester Post Revocable Living Trust
Create a Home Valuation Report for This Property
The Home Valuation Report is an in-depth analysis detailing your home's value as well as a comparison with similar homes in the area
Home Values in the Area
Average Home Value in this Area
Purchase History
| Date | Buyer | Sale Price | Title Company |
|---|---|---|---|
| Torres And Davies Family Trust | -- | None Listed On Document | |
| Lloyd Davies Wendy | -- | South Coast Title Company | |
| Lloyd Davies Wendy | -- | South Coast Title Company | |
| Lloyd Davies Jack Hastings | $165,000 | North American Title Co | |
| Post Lester | -- | -- |
Source: Public Records
Tax History
| Year | Tax Paid | Tax Assessment Tax Assessment Total Assessment is a certain percentage of the fair market value that is determined by local assessors to be the total taxable value of land and additions on the property. | Land | Improvement |
|---|---|---|---|---|
| 2025 | $3,361 | $283,869 | $199,425 | $84,444 |
| 2024 | $3,361 | $278,303 | $195,514 | $82,789 |
| 2023 | $3,278 | $272,847 | $191,681 | $81,166 |
| 2022 | $3,252 | $267,498 | $187,923 | $79,575 |
| 2021 | $3,197 | $262,253 | $184,238 | $78,015 |
| 2020 | $3,028 | $245,711 | $182,349 | $63,362 |
| 2019 | $2,954 | $240,894 | $178,774 | $62,120 |
| 2018 | $2,911 | $236,171 | $175,269 | $60,902 |
| 2017 | $2,863 | $231,541 | $171,833 | $59,708 |
| 2016 | $2,805 | $227,001 | $168,463 | $58,538 |
| 2015 | $2,729 | $223,592 | $165,933 | $57,659 |
| 2014 | $2,652 | $219,213 | $162,683 | $56,530 |
Source: Public Records
Map
Nearby Homes
- 513 N Yale Ave
- 151 N Lincoln Ave
- 1001 Nutwood Ave
- 208 N Cornell Ave
- 804 E Glenwood Ave
- 111 N Stanford Ave
- 1116 E Whiting Ave
- 705 E Santa fe Ave
- 1245 Riverside Dr
- 1318 Victoria Dr Unit B
- 1105 E Walnut Ave
- 1330 Victoria Dr Unit C
- 149 E Union Ave
- 1219 Frances Ave
- 16 Magnolia Viaduct
- 13 Palm Viaduct
- 1112 Riedel Ave
- 39 Pine Viaduct
- 1354 Shadow Ln Unit 102
- 1354 Shadow Ln Unit (D) 202
- 520 Princeton Cir E
- 512 Princeton Cir E
- 521 N Yale Ave
- 524 Princeton Cir E
- 525 N Yale Ave
- 517 N Yale Ave
- 517 Princeton Cir E
- 507 Princeton Cir E
- 521 Princeton Cir E
- 508 Princeton Cir E
- 528 Princeton Cir E
- 525 Princeton Cir E
- 503 Princeton Cir W
- 533 N Yale Ave
- 529 Princeton Cir E
- 504 Princeton Cir E
- 509 N Yale Ave
- 516 Princeton Cir W
- 532 Princeton Cir E
- 520 Princeton Cir W
Your Personal Tour Guide
Ask me questions while you tour the home.