Estimated Value: $278,586 - $321,000
4
Beds
2
Baths
912
Sq Ft
$331/Sq Ft
Est. Value
About This Home
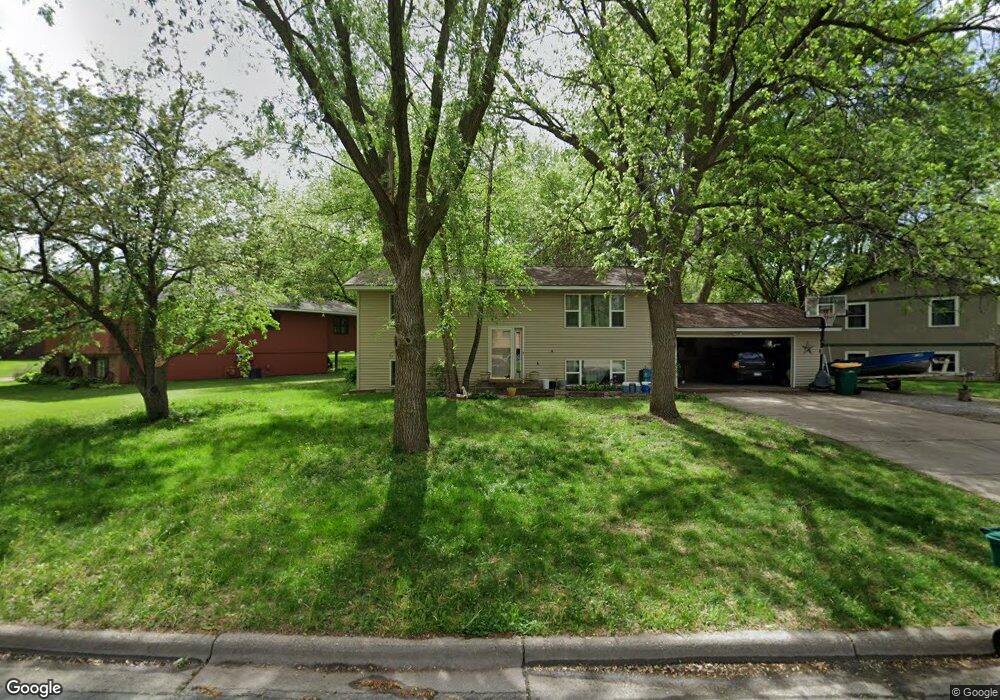
This home is located at 516 Ridge Rd, Mayer, MN 55360 and is currently estimated at $301,647, approximately $330 per square foot. 516 Ridge Rd is a home located in Carver County with nearby schools including Watertown-Mayer Elementary School, Watertown-Mayer Middle School, and Watertown Mayer High School.
Ownership History
Date
Name
Owned For
Owner Type
Purchase Details
Closed on
Feb 15, 2006
Sold by
Brueggemeier Chad and Brueggemeier Pamela M
Bought by
Platzer Michael R
Current Estimated Value
Home Financials for this Owner
Home Financials are based on the most recent Mortgage that was taken out on this home.
Original Mortgage
$130,000
Outstanding Balance
$73,185
Interest Rate
6.2%
Mortgage Type
New Conventional
Estimated Equity
$228,462
Purchase Details
Closed on
Sep 26, 2001
Sold by
Schimmelpfennig Dan J and Schimmelpfennig Glenda J
Bought by
Brueggemeier Chad
Purchase Details
Closed on
Feb 25, 2000
Sold by
Schimmelpfennig Daniel J and Schimmelpfennig Glenda J
Bought by
Brueggemeier Chad
Purchase Details
Closed on
Apr 19, 1999
Sold by
Schermann Jonathan and Schermann Lisa A
Bought by
Schimmelpfennig Daniel J and Schimmelpfennig Glenda J
Create a Home Valuation Report for This Property
The Home Valuation Report is an in-depth analysis detailing your home's value as well as a comparison with similar homes in the area
Home Values in the Area
Average Home Value in this Area
Purchase History
| Date | Buyer | Sale Price | Title Company |
|---|---|---|---|
| Platzer Michael R | $189,000 | -- | |
| Brueggemeier Chad | $127,000 | -- | |
| Brueggemeier Chad | $127,000 | -- | |
| Schimmelpfennig Daniel J | $119,500 | -- |
Source: Public Records
Mortgage History
| Date | Status | Borrower | Loan Amount |
|---|---|---|---|
| Open | Platzer Michael R | $130,000 | |
| Closed | Brueggemeier Chad | -- |
Source: Public Records
Tax History
| Year | Tax Paid | Tax Assessment Tax Assessment Total Assessment is a certain percentage of the fair market value that is determined by local assessors to be the total taxable value of land and additions on the property. | Land | Improvement |
|---|---|---|---|---|
| 2025 | $2,402 | $238,000 | $55,000 | $183,000 |
| 2024 | $2,464 | $238,000 | $55,000 | $183,000 |
| 2023 | $2,512 | $234,300 | $52,000 | $182,300 |
| 2022 | $2,296 | $227,500 | $52,000 | $175,500 |
| 2021 | $2,320 | $182,200 | $43,400 | $138,800 |
| 2020 | $2,368 | $182,200 | $43,400 | $138,800 |
| 2019 | $2,188 | $173,500 | $41,300 | $132,200 |
| 2018 | $2,186 | $173,500 | $41,300 | $132,200 |
| 2017 | $3,136 | $165,700 | $41,300 | $124,400 |
| 2016 | $3,182 | $119,500 | $0 | $0 |
| 2015 | $2,982 | $118,000 | $0 | $0 |
| 2014 | $2,982 | $97,200 | $0 | $0 |
Source: Public Records
Map
Nearby Homes
- 14067 62nd St
- 190 Morning Dr
- XXX 62nd St
- 2083 River Bend Trail
- 2091 River Bend Trail
- 2095 River Bend Trail
- 2102 River Bend Trail
- 2103 River Bend Trail
- 2107 River Bend Trail
- 1518 Hidden Trail
- 2119 River Bend Trail
- 5875 Highway 25
- 2127 River Bend Trail
- 2200 Timber Dr
- 1379 Birch Dr
- 7250 Rutz Lake Rd
- 127XX 58th St
- 14680 County Road 32
- 5225 Upland Ave
- 11165 66th St
Your Personal Tour Guide
Ask me questions while you tour the home.