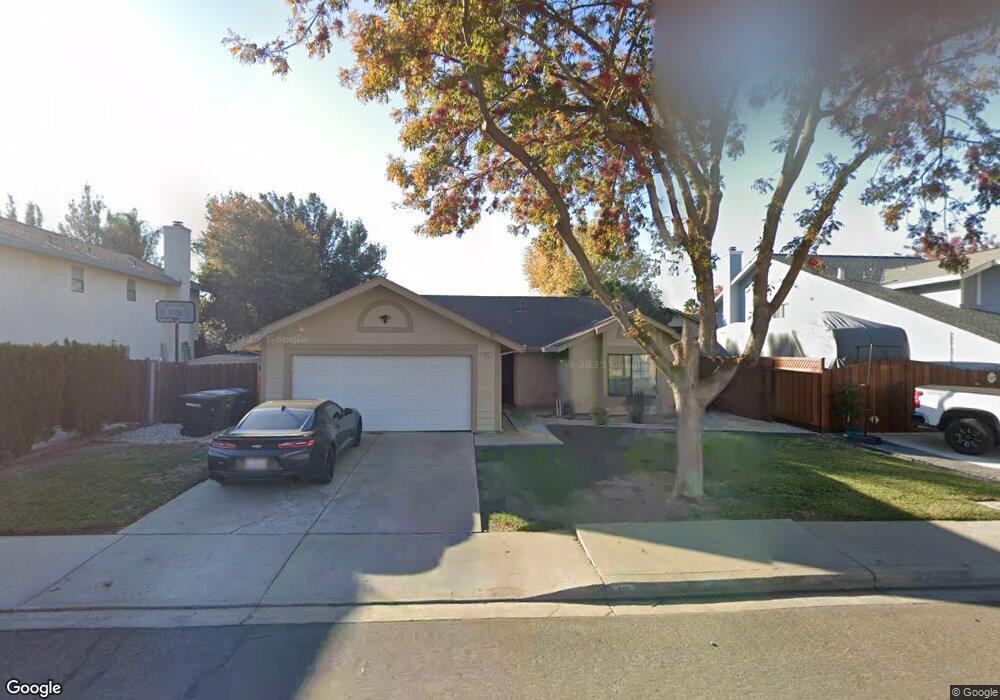
517 Moray Way Patterson, CA 95363
Estimated Value: $435,832 - $451,000
3
Beds
2
Baths
1,599
Sq Ft
$275/Sq Ft
Est. Value
About This Home
This home is located at 517 Moray Way, Patterson, CA 95363 and is currently estimated at $439,708, approximately $274 per square foot. 517 Moray Way is a home located in Stanislaus County with nearby schools including Las Palmas Elementary School, Creekside Middle School, and Patterson High School.
Ownership History
Date
Name
Owned For
Owner Type
Purchase Details
Closed on
Oct 3, 2012
Sold by
Andrade Robert
Bought by
Andrade Audrey L
Current Estimated Value
Home Financials for this Owner
Home Financials are based on the most recent Mortgage that was taken out on this home.
Original Mortgage
$96,000
Outstanding Balance
$15,960
Interest Rate
3.58%
Mortgage Type
New Conventional
Estimated Equity
$423,748
Purchase Details
Closed on
Aug 17, 1998
Sold by
Federal Home Loan Mortgage Corporation
Bought by
Andrade Robert and Andrade Audrey
Home Financials for this Owner
Home Financials are based on the most recent Mortgage that was taken out on this home.
Original Mortgage
$114,240
Interest Rate
6.88%
Mortgage Type
VA
Purchase Details
Closed on
Feb 27, 1998
Sold by
Kutlesa Ante J and Kutlesa Tomislav
Bought by
Federal Home Loan Mortgage Corporation
Create a Home Valuation Report for This Property
The Home Valuation Report is an in-depth analysis detailing your home's value as well as a comparison with similar homes in the area
Home Values in the Area
Average Home Value in this Area
Purchase History
| Date | Buyer | Sale Price | Title Company |
|---|---|---|---|
| Andrade Audrey L | -- | First American Title Company | |
| Andrade Robert | $112,000 | Fidelity National Title Co | |
| Federal Home Loan Mortgage Corporation | $110,000 | Fidelity National Title |
Source: Public Records
Mortgage History
| Date | Status | Borrower | Loan Amount |
|---|---|---|---|
| Open | Andrade Audrey L | $96,000 | |
| Closed | Andrade Robert | $114,240 |
Source: Public Records
Tax History
| Year | Tax Paid | Tax Assessment Tax Assessment Total Assessment is a certain percentage of the fair market value that is determined by local assessors to be the total taxable value of land and additions on the property. | Land | Improvement |
|---|---|---|---|---|
| 2025 | $2,055 | $175,565 | $39,184 | $136,381 |
| 2024 | $2,047 | $172,123 | $38,416 | $133,707 |
| 2023 | $2,002 | $168,749 | $37,663 | $131,086 |
| 2022 | $1,891 | $165,441 | $36,925 | $128,516 |
| 2021 | $1,864 | $162,198 | $36,201 | $125,997 |
| 2020 | $1,864 | $160,536 | $35,830 | $124,706 |
| 2019 | $1,836 | $157,389 | $35,128 | $122,261 |
| 2018 | $1,750 | $154,304 | $34,440 | $119,864 |
| 2017 | $1,713 | $151,279 | $33,765 | $117,514 |
| 2016 | $1,668 | $148,313 | $33,103 | $115,210 |
| 2015 | $1,607 | $146,086 | $32,606 | $113,480 |
| 2014 | $1,572 | $143,226 | $31,968 | $111,258 |
Source: Public Records
Map
Nearby Homes
- 708 Bonneau Ct
- 15707 S 9th St
- 850 Miraggio Dr
- 855 Toyon Ln
- 191 Fall Ave
- 1008 Summer Ln
- 1117 Van Gogh Ln
- 1127 Kestrel Dr
- 1132 Marsh Wren Ct
- 357 Wolfpack Ct
- 1242 Yellowhammer Dr
- 409 Osprey Dr
- 433 Sanderling Dr
- 642 Wanzia Ct
- 647 Ward Ave
- 1314 Sutter Creek Ct
- 432 Meadow Creek Dr
- 216 Barros St
- 1413 Angus St
- 192 Torvend Way
Your Personal Tour Guide
Ask me questions while you tour the home.