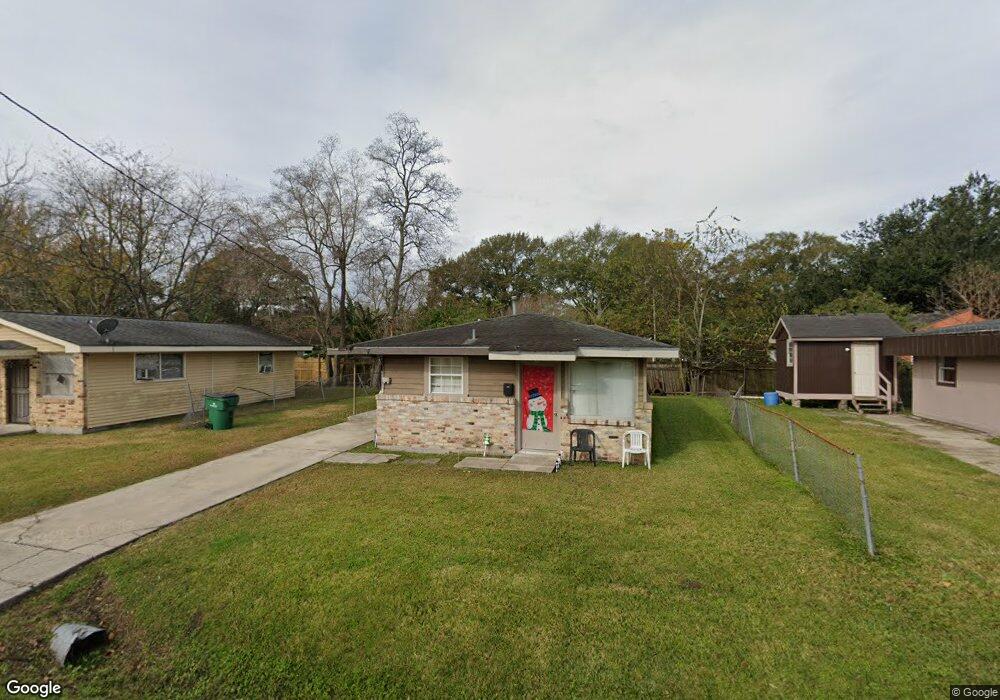
518 Paul Fredrick St Luling, LA 70070
Estimated Value: $76,000 - $167,000
2
Beds
1
Bath
700
Sq Ft
$173/Sq Ft
Est. Value
About This Home
This home is located at 518 Paul Fredrick St, Luling, LA 70070 and is currently estimated at $121,131, approximately $173 per square foot. 518 Paul Fredrick St is a home located in St. Charles Parish with nearby schools including Luling Elementary School, R.K. Smith Middle School, and Hahnville High School.
Ownership History
Date
Name
Owned For
Owner Type
Purchase Details
Closed on
Aug 17, 2021
Sold by
Lupo John G
Bought by
Lupo John Mack and Lupo Jacquelyn B
Current Estimated Value
Home Financials for this Owner
Home Financials are based on the most recent Mortgage that was taken out on this home.
Original Mortgage
$55,000
Outstanding Balance
$49,578
Interest Rate
2.9%
Mortgage Type
New Conventional
Estimated Equity
$71,553
Purchase Details
Closed on
Nov 10, 2006
Sold by
Clark Jennifer Brissett and Clark Lloyd A
Bought by
Lupo John G
Home Financials for this Owner
Home Financials are based on the most recent Mortgage that was taken out on this home.
Original Mortgage
$61,600
Interest Rate
6.26%
Mortgage Type
New Conventional
Purchase Details
Closed on
Mar 14, 2005
Sold by
Bartlett William H and Barrois Sharon A
Bought by
Clark Lloyd A
Create a Home Valuation Report for This Property
The Home Valuation Report is an in-depth analysis detailing your home's value as well as a comparison with similar homes in the area
Home Values in the Area
Average Home Value in this Area
Purchase History
| Date | Buyer | Sale Price | Title Company |
|---|---|---|---|
| Lupo John Mack | $55,000 | None Available | |
| Lupo John G | $77,000 | Elite Title Insurance Agency | |
| Clark Lloyd A | $25,000 | None Available |
Source: Public Records
Mortgage History
| Date | Status | Borrower | Loan Amount |
|---|---|---|---|
| Open | Lupo John Mack | $55,000 | |
| Previous Owner | Lupo John G | $61,600 |
Source: Public Records
Tax History
| Year | Tax Paid | Tax Assessment Tax Assessment Total Assessment is a certain percentage of the fair market value that is determined by local assessors to be the total taxable value of land and additions on the property. | Land | Improvement |
|---|---|---|---|---|
| 2025 | $687 | $6,800 | $2,020 | $4,780 |
| 2024 | $687 | $6,800 | $2,020 | $4,780 |
| 2023 | $698 | $6,159 | $1,240 | $4,919 |
| 2022 | $720 | $6,159 | $1,240 | $4,919 |
| 2021 | $549 | $4,658 | $1,116 | $3,542 |
| 2020 | $728 | $6,160 | $1,240 | $4,920 |
| 2019 | $730 | $6,160 | $954 | $5,206 |
| 2018 | $725 | $6,160 | $954 | $5,206 |
| 2017 | $724 | $6,160 | $954 | $5,206 |
| 2016 | $727 | $6,160 | $954 | $5,206 |
| 2015 | $724 | $6,160 | $954 | $5,206 |
| 2014 | $698 | $6,160 | $954 | $5,206 |
| 2013 | $700 | $6,160 | $954 | $5,206 |
Source: Public Records
Map
Nearby Homes
- 514 Milling Ave
- 412 Milling Ave
- 131 Antoine Ln
- 304 4th St
- 708 Sugarhouse Rd
- 826 Mongrue St
- 1008 Gassen St
- 1262 Luling Estates Dr
- 109 Lac Cypriere Dr
- 1214 Gassen St
- 1216 Gassen St
- 204 Lac Segnette Dr
- LOTS J2A 3-4-5-&6 E Campus Dr
- LOTS J2A 3-4-5- E Campus Dr
- LOT J2A-5&6 E Campus Dr
- 214 Ashton Oaks Ln
- 205 Cove Pointe Dr
- 301 Allie Ln
- 520 Paul Fredrick St
- 522 Paul Fredrick St
- 524 Paul Fredrick St
- 515 Kinler St
- 513 Kinler St
- 513 Kinler St
- 602 Paul Fredrick St
- 517 Kinler St
- 516 Paul Fredrick St
- 517 Paul Fredrick St
- 511 Kinler St
- 600 Paul Fredrick St
- 523 Paul Fredrick St
- 519 Kinler St
- 519 Kinler St
- 519 Kinler St
- 511 Paul Fredrick St
- 200 Brooklyn St
- 516 Kinler St
- 514 Kinler St
Your Personal Tour Guide
Ask me questions while you tour the home.