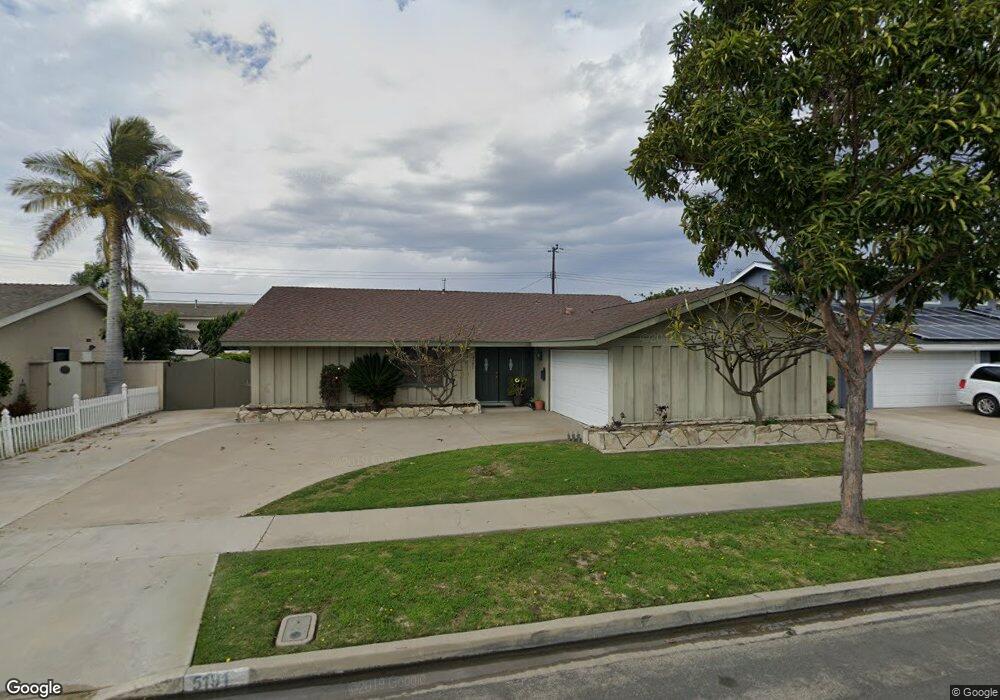
5191 Dartmouth Ave Westminster, CA 92683
Estimated Value: $1,182,631 - $1,228,000
4
Beds
2
Baths
1,944
Sq Ft
$614/Sq Ft
Est. Value
About This Home
This home is located at 5191 Dartmouth Ave, Westminster, CA 92683 and is currently estimated at $1,194,408, approximately $614 per square foot. 5191 Dartmouth Ave is a home located in Orange County with nearby schools including Eastwood Elementary School, Helen Stacey Intermediate School, and Westminster High School.
Ownership History
Date
Name
Owned For
Owner Type
Purchase Details
Closed on
Nov 23, 2021
Sold by
Newell Carmen P
Bought by
Newell Carmen P and Newell Carmen P
Current Estimated Value
Purchase Details
Closed on
Jul 25, 2008
Sold by
Newell Carmen P
Bought by
Newell Carmen P
Home Financials for this Owner
Home Financials are based on the most recent Mortgage that was taken out on this home.
Original Mortgage
$235,000
Outstanding Balance
$154,841
Interest Rate
6.41%
Mortgage Type
New Conventional
Estimated Equity
$1,039,567
Purchase Details
Closed on
Sep 15, 2003
Sold by
Newell Robert S
Bought by
Newell Carmen P
Purchase Details
Closed on
May 22, 2000
Sold by
Morrison William E
Bought by
Newell Robert S and Newell Carmen P
Home Financials for this Owner
Home Financials are based on the most recent Mortgage that was taken out on this home.
Original Mortgage
$160,000
Interest Rate
8.2%
Create a Home Valuation Report for This Property
The Home Valuation Report is an in-depth analysis detailing your home's value as well as a comparison with similar homes in the area
Home Values in the Area
Average Home Value in this Area
Purchase History
| Date | Buyer | Sale Price | Title Company |
|---|---|---|---|
| Newell Carmen P | -- | None Available | |
| Newell Carmen P | -- | Multiple | |
| Newell Carmen P | -- | -- | |
| Newell Robert S | $280,000 | First American Title Co |
Source: Public Records
Mortgage History
| Date | Status | Borrower | Loan Amount |
|---|---|---|---|
| Open | Newell Carmen P | $235,000 | |
| Previous Owner | Newell Robert S | $160,000 |
Source: Public Records
Tax History Compared to Growth
Tax History
| Year | Tax Paid | Tax Assessment Tax Assessment Total Assessment is a certain percentage of the fair market value that is determined by local assessors to be the total taxable value of land and additions on the property. | Land | Improvement |
|---|---|---|---|---|
| 2025 | $1,963 | $123,353 | $58,336 | $65,017 |
| 2024 | $1,963 | $120,935 | $57,192 | $63,743 |
| 2023 | $1,896 | $118,564 | $56,070 | $62,494 |
| 2022 | $1,858 | $116,240 | $54,971 | $61,269 |
| 2021 | $1,802 | $113,961 | $53,893 | $60,068 |
| 2020 | $1,783 | $112,793 | $53,340 | $59,453 |
| 2019 | $1,767 | $110,582 | $52,294 | $58,288 |
| 2018 | $1,762 | $108,414 | $51,268 | $57,146 |
| 2017 | $1,710 | $106,289 | $50,263 | $56,026 |
| 2016 | $1,667 | $104,205 | $49,277 | $54,928 |
| 2015 | $1,642 | $102,640 | $48,537 | $54,103 |
| 2014 | $1,609 | $100,630 | $47,586 | $53,044 |
Source: Public Records
Map
Nearby Homes
- 5042 Cumberland Ave
- 5302 Clark Cir
- 5102 Piccadilly Cir
- 13966 Chelmsford Walk
- 14121 Uxbridge St
- 5621 Marilyn Cir
- 13722 Hammon Place
- 5781 Vallecito Dr
- 5056 Hampton Ct
- 5042 Hampton Ct
- 14422 Birmingham Dr
- 13671 Springdale St
- 13582 Springdale St
- 13562 Springdale St
- 5781 Westmoreland Cir
- 13371 Springdale St
- 5792 Gloucester Cir
- 12741 Bartlett St
- 13100 Melanie Ln Unit 99
- 3520 Jasmin Cir
- 5171 Dartmouth Ave
- 5201 Dartmouth Ave
- 5192 Berkeley Ave
- 5172 Berkeley Ave
- 5202 Berkeley Ave
- 5161 Dartmouth Ave
- 5211 Dartmouth Ave
- 5182 Dartmouth Ave
- 5202 Dartmouth Ave
- 5162 Berkeley Ave
- 5212 Berkeley Ave
- 5172 Dartmouth Ave
- 5212 Dartmouth Ave
- 5231 Dartmouth Ave
- 5151 Dartmouth Ave
- 5162 Dartmouth Ave
- 5222 Dartmouth Ave
- 5152 Berkeley Ave
- 5232 Berkeley Ave
- 5191 Berkeley Ave