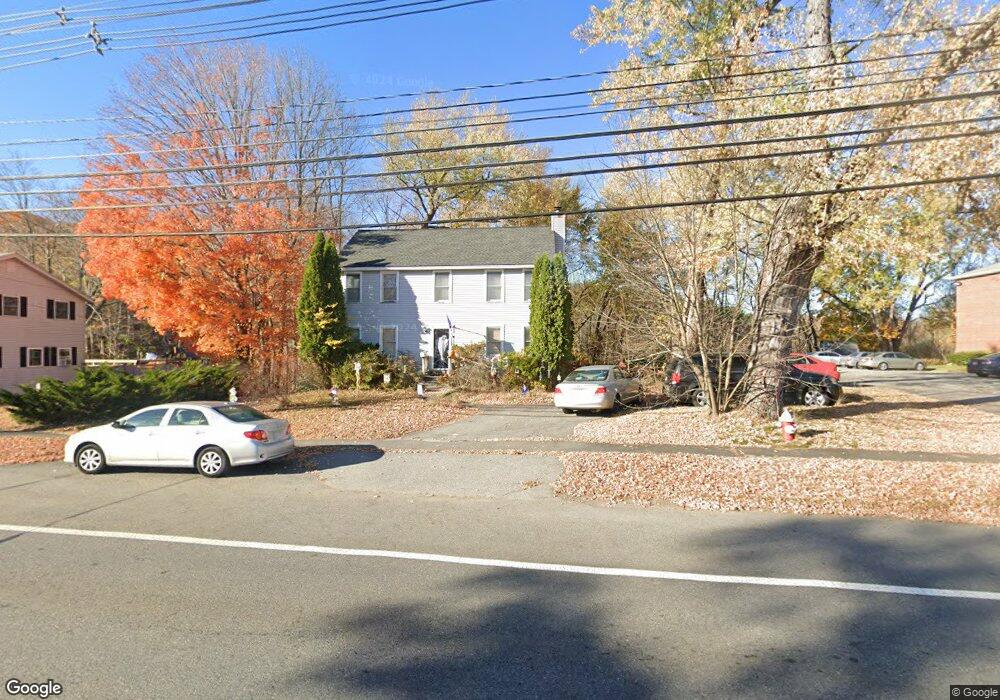
52 E Main St Merrimac, MA 01860
Estimated Value: $563,000 - $662,000
3
Beds
2
Baths
1,680
Sq Ft
$369/Sq Ft
Est. Value
About This Home
This home is located at 52 E Main St, Merrimac, MA 01860 and is currently estimated at $620,028, approximately $369 per square foot. 52 E Main St is a home located in Essex County with nearby schools including Pentucket Regional High School.
Ownership History
Date
Name
Owned For
Owner Type
Purchase Details
Closed on
Nov 8, 1995
Sold by
Arcadia Land Dev Inc
Bought by
Freeman Glen E and Freeman Bonnie L
Current Estimated Value
Home Financials for this Owner
Home Financials are based on the most recent Mortgage that was taken out on this home.
Original Mortgage
$100,000
Interest Rate
7.62%
Mortgage Type
Purchase Money Mortgage
Create a Home Valuation Report for This Property
The Home Valuation Report is an in-depth analysis detailing your home's value as well as a comparison with similar homes in the area
Home Values in the Area
Average Home Value in this Area
Purchase History
| Date | Buyer | Sale Price | Title Company |
|---|---|---|---|
| Freeman Glen E | $140,000 | -- |
Source: Public Records
Mortgage History
| Date | Status | Borrower | Loan Amount |
|---|---|---|---|
| Open | Freeman Glen E | $97,000 | |
| Closed | Freeman Glen E | $100,000 |
Source: Public Records
Tax History
| Year | Tax Paid | Tax Assessment Tax Assessment Total Assessment is a certain percentage of the fair market value that is determined by local assessors to be the total taxable value of land and additions on the property. | Land | Improvement |
|---|---|---|---|---|
| 2025 | $7,432 | $560,900 | $297,600 | $263,300 |
| 2024 | $7,297 | $540,500 | $281,000 | $259,500 |
| 2023 | $6,678 | $452,100 | $238,100 | $214,000 |
| 2022 | $6,051 | $370,300 | $191,800 | $178,500 |
| 2021 | $5,765 | $353,700 | $175,200 | $178,500 |
| 2020 | $5,263 | $353,700 | $175,200 | $178,500 |
| 2019 | $5,103 | $322,800 | $152,100 | $170,700 |
| 2018 | $4,873 | $309,200 | $142,200 | $167,000 |
| 2017 | $4,583 | $280,500 | $119,000 | $161,500 |
| 2016 | $4,475 | $276,900 | $119,000 | $157,900 |
| 2015 | $4,287 | $263,800 | $119,000 | $144,800 |
| 2014 | $4,192 | $263,800 | $119,000 | $144,800 |
Source: Public Records
Map
Nearby Homes
- 50 E Main St
- 59 E Main St
- 58 E Main St
- 45 E Main St
- 47 E Main St
- 43 E Main St
- 44 E Main St Unit 46
- 65 E Main St
- 48 E Main St
- 63 E Main St Unit 65
- 63 E Main St
- 63 E Main St Unit 63
- 63 E Main St
- 63 1/2 E Main St
- 40 E Main St Unit B
- 42 E Main St Unit A
- 74 E Main St
- 69 E Main St
- 38 E Main St
- 37 E Main St
Your Personal Tour Guide
Ask me questions while you tour the home.