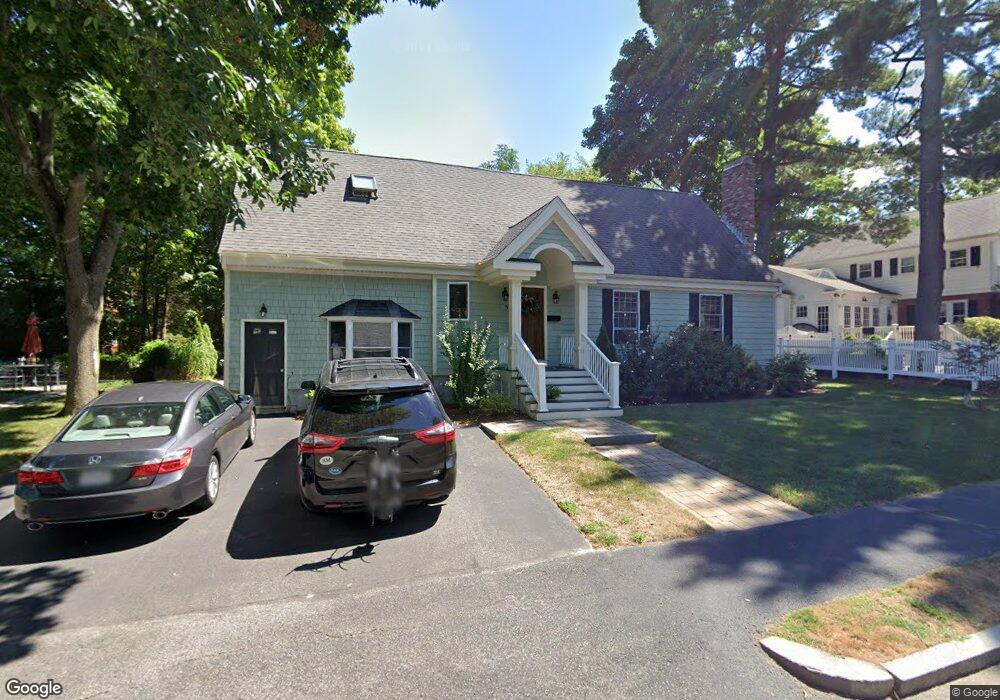
52 Lyme Rd West Newton, MA 02465
West Newton NeighborhoodEstimated Value: $1,551,282 - $1,788,000
4
Beds
3
Baths
2,681
Sq Ft
$607/Sq Ft
Est. Value
About This Home
This home is located at 52 Lyme Rd, West Newton, MA 02465 and is currently estimated at $1,626,821, approximately $606 per square foot. 52 Lyme Rd is a home located in Middlesex County with nearby schools including Franklin Elementary School, F.A. Day Middle School, and Newton North High School.
Ownership History
Date
Name
Owned For
Owner Type
Purchase Details
Closed on
Jun 30, 2015
Sold by
Capello Francis P and Capello Elizabeth A
Bought by
Barberio Joseph L and Barberio Megan L
Current Estimated Value
Home Financials for this Owner
Home Financials are based on the most recent Mortgage that was taken out on this home.
Original Mortgage
$716,000
Outstanding Balance
$557,904
Interest Rate
3.84%
Mortgage Type
Purchase Money Mortgage
Estimated Equity
$1,068,917
Purchase Details
Closed on
Feb 6, 1987
Sold by
Frazitta Robert M
Bought by
Capello Francis P
Home Financials for this Owner
Home Financials are based on the most recent Mortgage that was taken out on this home.
Original Mortgage
$95,000
Interest Rate
9.23%
Mortgage Type
Purchase Money Mortgage
Create a Home Valuation Report for This Property
The Home Valuation Report is an in-depth analysis detailing your home's value as well as a comparison with similar homes in the area
Home Values in the Area
Average Home Value in this Area
Purchase History
| Date | Buyer | Sale Price | Title Company |
|---|---|---|---|
| Barberio Joseph L | $895,000 | -- | |
| Capello Francis P | $235,000 | -- |
Source: Public Records
Mortgage History
| Date | Status | Borrower | Loan Amount |
|---|---|---|---|
| Open | Barberio Joseph L | $716,000 | |
| Previous Owner | Capello Francis P | $140,000 | |
| Previous Owner | Capello Francis P | $43,086 | |
| Previous Owner | Capello Francis P | $95,000 |
Source: Public Records
Tax History Compared to Growth
Tax History
| Year | Tax Paid | Tax Assessment Tax Assessment Total Assessment is a certain percentage of the fair market value that is determined by local assessors to be the total taxable value of land and additions on the property. | Land | Improvement |
|---|---|---|---|---|
| 2025 | $13,093 | $1,336,000 | $820,400 | $515,600 |
| 2024 | $12,660 | $1,297,100 | $796,500 | $500,600 |
| 2023 | $11,809 | $1,160,000 | $604,000 | $556,000 |
| 2022 | $11,300 | $1,074,100 | $559,300 | $514,800 |
| 2021 | $10,903 | $1,013,300 | $527,600 | $485,700 |
| 2020 | $10,579 | $1,013,300 | $527,600 | $485,700 |
| 2019 | $15,214 | $988,600 | $512,200 | $476,400 |
| 2018 | $9,770 | $903,000 | $463,500 | $439,500 |
| 2017 | $9,473 | $851,900 | $437,300 | $414,600 |
| 2016 | $7,963 | $699,700 | $408,700 | $291,000 |
| 2015 | $7,592 | $653,900 | $382,000 | $271,900 |
Source: Public Records
Map
Nearby Homes
- 76 Harding St
- 75 Cherry St
- 76 Taft Ave Unit 1
- 76 Taft Ave
- 76 Taft Ave Unit 2
- 41 Kilburn Rd
- 287 Cherry St Unit 2
- 321 Albemarle Rd
- 33 Joseph Rd
- 11 Randlett Park
- 44 Westland Ave
- 56 Dearborn St
- 14 Cottage Place Unit 14
- 27 Cross St Unit 27
- 106 River St Unit 18
- 106 River St Unit 2
- 106 River St Unit 14
- 371 Cherry St
- 2 Elm St Unit 6
- 2 Elm St Unit 8