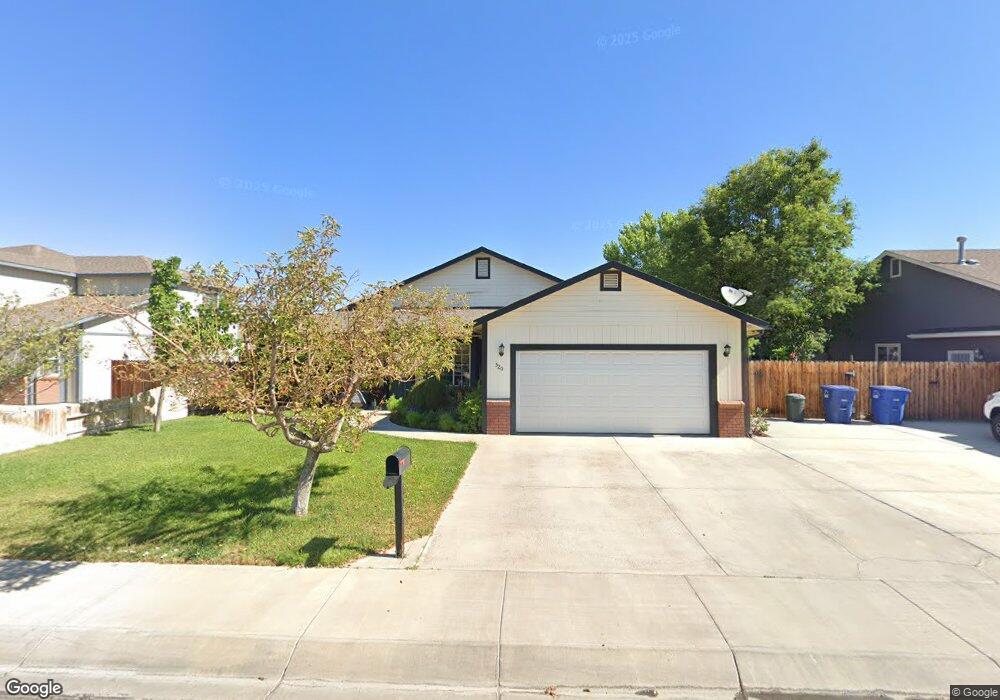
520 Dani St Fallon, NV 89406
Estimated Value: $374,932 - $403,000
3
Beds
2
Baths
1,594
Sq Ft
$243/Sq Ft
Est. Value
About This Home
This home is located at 520 Dani St, Fallon, NV 89406 and is currently estimated at $386,983, approximately $242 per square foot. 520 Dani St is a home located in Churchill County with nearby schools including Lahontan Elementary School, E.C. Best Elementary School, and Numa Elementary School.
Ownership History
Date
Name
Owned For
Owner Type
Purchase Details
Closed on
Dec 7, 2006
Sold by
Boynton Colin K and Boynton Heather B
Bought by
Barton Brad and Barton Dana
Current Estimated Value
Home Financials for this Owner
Home Financials are based on the most recent Mortgage that was taken out on this home.
Original Mortgage
$204,000
Outstanding Balance
$122,035
Interest Rate
6.32%
Mortgage Type
Purchase Money Mortgage
Estimated Equity
$264,948
Create a Home Valuation Report for This Property
The Home Valuation Report is an in-depth analysis detailing your home's value as well as a comparison with similar homes in the area
Home Values in the Area
Average Home Value in this Area
Purchase History
| Date | Buyer | Sale Price | Title Company |
|---|---|---|---|
| Barton Brad | $200,000 | Western Nevada Title Company |
Source: Public Records
Mortgage History
| Date | Status | Borrower | Loan Amount |
|---|---|---|---|
| Open | Barton Brad | $204,000 |
Source: Public Records
Tax History
| Year | Tax Paid | Tax Assessment Tax Assessment Total Assessment is a certain percentage of the fair market value that is determined by local assessors to be the total taxable value of land and additions on the property. | Land | Improvement |
|---|---|---|---|---|
| 2025 | $2,545 | $86,037 | $21,700 | $64,337 |
| 2024 | $2,545 | $84,976 | $19,950 | $65,026 |
| 2023 | $2,545 | $80,875 | $19,950 | $60,925 |
| 2022 | $2,181 | $64,705 | $11,900 | $52,805 |
| 2021 | $2,018 | $63,228 | $11,900 | $51,328 |
| 2020 | $1,944 | $59,098 | $11,900 | $47,198 |
| 2019 | $1,876 | $57,942 | $11,900 | $46,042 |
| 2018 | $1,791 | $56,746 | $11,900 | $44,846 |
| 2017 | $1,719 | $55,479 | $10,500 | $44,979 |
| 2016 | $1,675 | $49,496 | $7,875 | $41,621 |
| 2015 | $1,643 | $44,720 | $7,875 | $36,845 |
| 2014 | $1,598 | $41,609 | $7,875 | $33,734 |
Source: Public Records
Map
Nearby Homes
- 641 Megan Way
- 775 Karry Way
- 806 Karry Way
- 530 Michael Dr
- 285 Amanda Ln
- 119 Toiyabe Ln
- 800 Great Basin Ln
- 815 Great Basin Ln
- 1141 Alder Dr
- 882 Great Basin Ln
- 215 Hunter Park Way
- 681 Keppel St
- 621 Keppel St
- 120 Hunter Park Way
- 728 Keppel St
- 618 Keppel St
- 604 Keppel St
- 343 Crystal Ct
- 1755 Coleman Rd
- 604 Serpa Place
Your Personal Tour Guide
Ask me questions while you tour the home.