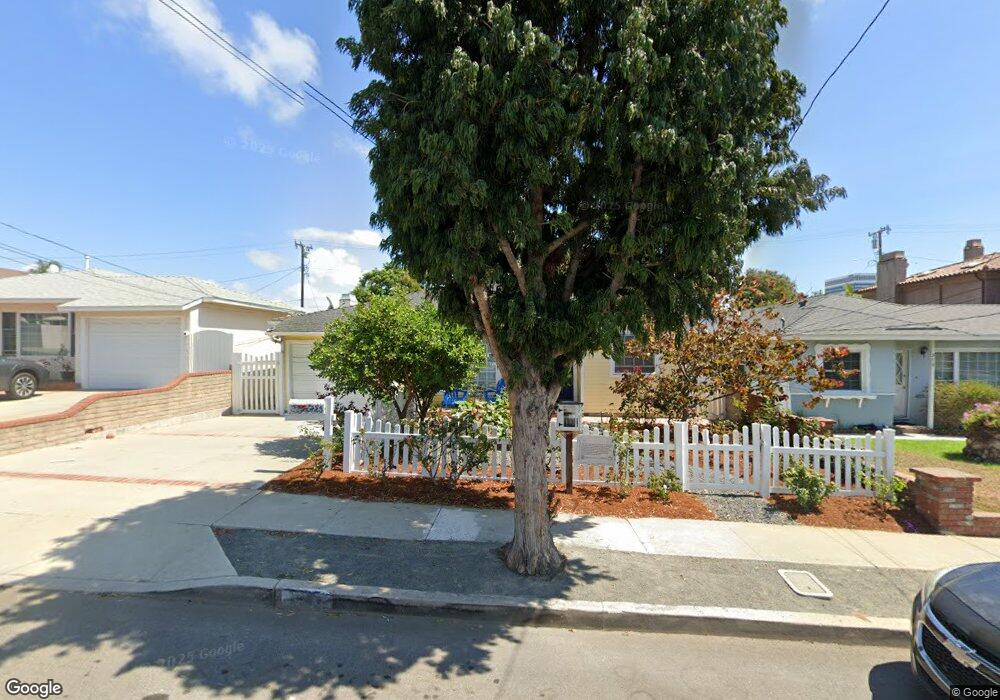
520 Oregon St El Segundo, CA 90245
Estimated Value: $1,305,000 - $1,812,704
4
Beds
3
Baths
1,773
Sq Ft
$923/Sq Ft
Est. Value
About This Home
This home is located at 520 Oregon St, El Segundo, CA 90245 and is currently estimated at $1,636,176, approximately $922 per square foot. 520 Oregon St is a home located in Los Angeles County with nearby schools including Center Street Elementary, El Segundo Middle School, and El Segundo High School.
Ownership History
Date
Name
Owned For
Owner Type
Purchase Details
Closed on
Dec 12, 2018
Sold by
Elliott Martin James and Watson Kathryn Elaine
Bought by
Elliott Martin J and Watson Kathryn E
Current Estimated Value
Purchase Details
Closed on
Jun 27, 2006
Sold by
Elliott Martin James and Watson Kathryn Elaine
Bought by
Elliott Martin James and Watson Kathryn Elaine
Home Financials for this Owner
Home Financials are based on the most recent Mortgage that was taken out on this home.
Original Mortgage
$606,000
Outstanding Balance
$349,130
Interest Rate
6.12%
Mortgage Type
Purchase Money Mortgage
Estimated Equity
$1,287,046
Purchase Details
Closed on
Sep 4, 1998
Sold by
Lane Trust and Bill
Bought by
Elliott Martin James and Watson Kathryn Elaine
Home Financials for this Owner
Home Financials are based on the most recent Mortgage that was taken out on this home.
Original Mortgage
$263,200
Interest Rate
6.79%
Purchase Details
Closed on
Sep 19, 1991
Sold by
Lane Lucille and Lane Lucille E
Bought by
Lane Lucille and Lane Trust
Create a Home Valuation Report for This Property
The Home Valuation Report is an in-depth analysis detailing your home's value as well as a comparison with similar homes in the area
Home Values in the Area
Average Home Value in this Area
Purchase History
| Date | Buyer | Sale Price | Title Company |
|---|---|---|---|
| Elliott Martin J | -- | None Available | |
| Elliott Martin James | -- | Financial Title Company | |
| Elliott Martin James | $329,000 | Southland Title | |
| Lane Lucille | -- | -- |
Source: Public Records
Mortgage History
| Date | Status | Borrower | Loan Amount |
|---|---|---|---|
| Open | Elliott Martin James | $606,000 | |
| Closed | Elliott Martin James | $263,200 |
Source: Public Records
Tax History
| Year | Tax Paid | Tax Assessment Tax Assessment Total Assessment is a certain percentage of the fair market value that is determined by local assessors to be the total taxable value of land and additions on the property. | Land | Improvement |
|---|---|---|---|---|
| 2025 | $6,787 | $600,132 | $412,613 | $187,519 |
| 2024 | $6,787 | $588,366 | $404,523 | $183,843 |
| 2023 | $6,614 | $576,831 | $396,592 | $180,239 |
| 2022 | $5,727 | $486,012 | $388,816 | $97,196 |
| 2021 | $5,650 | $476,484 | $381,193 | $95,291 |
| 2019 | $5,460 | $462,353 | $369,888 | $92,465 |
| 2018 | $5,072 | $453,288 | $362,636 | $90,652 |
| 2016 | $4,926 | $435,688 | $348,555 | $87,133 |
| 2015 | $4,865 | $429,145 | $343,320 | $85,825 |
| 2014 | $4,768 | $420,739 | $336,595 | $84,144 |
Source: Public Records
Map
Nearby Homes
- 1345 E Grand Ave
- 1225 E Grand Ave Unit B
- 305 Kansas St Unit D
- 432 Lomita St
- 1510 E Maple Ave
- 1514 E Maple Ave
- 825 Center St
- 529 Sierra Place
- 606 Penn St
- 860 Bungalow Dr
- 623 E Grand Ave
- 318 Penn St Unit 2
- 1116 E Imperial Ave
- 1112 E Imperial Ave
- 500 E Imperial Ave
- 842 Penn St
- 906 E Imperial Ave
- 529 E Walnut Ave
- 226 Arena St Unit B
- 226 Arena St
- 524 Oregon St
- 516 Oregon St
- 512 Oregon St
- 1308 E Mariposa Ave
- 510 Oregon St
- 1312 E Mariposa Ave
- 1304 E Mariposa Ave
- 525 California St
- 515 California St
- 1352 E Mariposa Ave
- 506 Oregon St
- 525 Oregon St
- 1356 E Mariposa Ave
- 1236 E Mariposa Ave
- 509 California St
- 517 Oregon St
- 500 Oregon St
- 1360 E Mariposa Ave
- 505 California St
- 1230 E Mariposa Ave
Your Personal Tour Guide
Ask me questions while you tour the home.