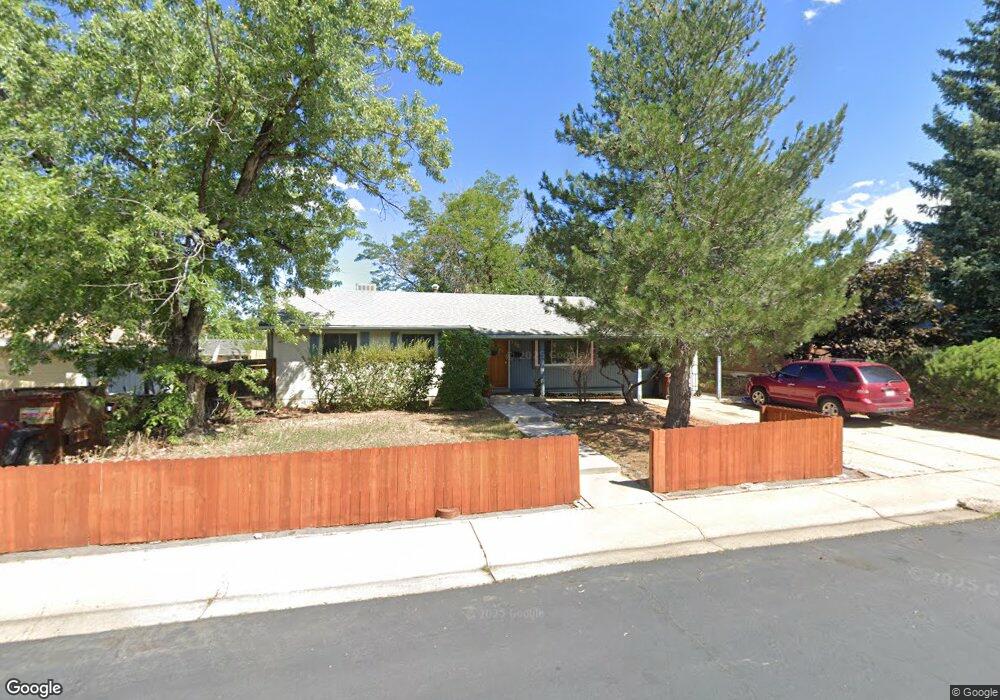
520 S 43rd St Boulder, CO 80305
South Boulder NeighborhoodEstimated Value: $839,300 - $939,000
4
Beds
3
Baths
2,100
Sq Ft
$426/Sq Ft
Est. Value
About This Home
This home is located at 520 S 43rd St, Boulder, CO 80305 and is currently estimated at $895,325, approximately $426 per square foot. 520 S 43rd St is a home located in Boulder County with nearby schools including Creekside Elementary School, Southern Hills Middle School, and Fairview High School.
Ownership History
Date
Name
Owned For
Owner Type
Purchase Details
Closed on
Apr 28, 2008
Sold by
Peascoe David
Bought by
Deneen Mathew
Current Estimated Value
Home Financials for this Owner
Home Financials are based on the most recent Mortgage that was taken out on this home.
Original Mortgage
$316,000
Outstanding Balance
$200,017
Interest Rate
5.87%
Mortgage Type
New Conventional
Estimated Equity
$695,308
Purchase Details
Closed on
Jun 15, 2007
Sold by
Wiersema Gerrit D
Bought by
Peascoe David
Home Financials for this Owner
Home Financials are based on the most recent Mortgage that was taken out on this home.
Original Mortgage
$290,400
Interest Rate
6.15%
Mortgage Type
Purchase Money Mortgage
Purchase Details
Closed on
Feb 5, 1992
Bought by
Deneen Mathew and Deneen Lindsey A
Purchase Details
Closed on
Apr 19, 1988
Bought by
Deneen Mathew and Deneen Lindsey A
Purchase Details
Closed on
Oct 2, 1985
Bought by
Deneen Mathew and Deneen Lindsey A
Purchase Details
Closed on
Oct 13, 1977
Bought by
Deneen Mathew and Deneen Lindsey A
Create a Home Valuation Report for This Property
The Home Valuation Report is an in-depth analysis detailing your home's value as well as a comparison with similar homes in the area
Home Values in the Area
Average Home Value in this Area
Purchase History
| Date | Buyer | Sale Price | Title Company |
|---|---|---|---|
| Deneen Mathew | $395,000 | Utc Colorado | |
| Peascoe David | $363,000 | First Colorado Title | |
| Deneen Mathew | $108,000 | -- | |
| Deneen Mathew | $88,500 | -- | |
| Deneen Mathew | $93,000 | -- | |
| Deneen Mathew | $49,900 | -- |
Source: Public Records
Mortgage History
| Date | Status | Borrower | Loan Amount |
|---|---|---|---|
| Open | Deneen Mathew | $316,000 | |
| Previous Owner | Peascoe David | $290,400 |
Source: Public Records
Tax History
| Year | Tax Paid | Tax Assessment Tax Assessment Total Assessment is a certain percentage of the fair market value that is determined by local assessors to be the total taxable value of land and additions on the property. | Land | Improvement |
|---|---|---|---|---|
| 2025 | $4,943 | $51,856 | $29,931 | $21,925 |
| 2024 | $4,943 | $51,856 | $29,931 | $21,925 |
| 2023 | $4,857 | $56,247 | $35,369 | $24,562 |
| 2022 | $4,309 | $46,399 | $26,334 | $20,065 |
| 2021 | $4,109 | $47,733 | $27,091 | $20,642 |
| 2020 | $4,019 | $46,175 | $25,597 | $20,578 |
| 2019 | $3,958 | $46,175 | $25,597 | $20,578 |
| 2018 | $3,656 | $42,163 | $23,544 | $18,619 |
| 2017 | $3,541 | $46,614 | $26,029 | $20,585 |
| 2016 | $3,314 | $38,288 | $16,398 | $21,890 |
| 2015 | $3,139 | $31,108 | $12,418 | $18,690 |
| 2014 | $2,616 | $31,108 | $12,418 | $18,690 |
Source: Public Records
Map
Nearby Homes
- 450 S 41st St
- 725 S 45th St
- 4453 Hamilton Ct
- 345 S 38th St
- 210 S 39th St
- 4595 Moorhead Ave
- 4835 Moorhead Ave
- 4763 Tantra Dr Unit B
- 3805 Martin Dr
- 800 W Moorhead Cir Unit E
- 750 W Moorhead Cir Unit A
- 4445 Squires Cir
- 860 W Moorhead Cir Unit 2K
- 860 W Moorhead Cir Unit 1I
- 860 W Moorhead Cir Unit 2H
- 4445 Grinnell Ave
- 4800 Osage Dr Unit B-16
- 2955 Stanford Ave
- 3000 Dartmouth Ave
- 4380 Ludlow St
Your Personal Tour Guide
Ask me questions while you tour the home.