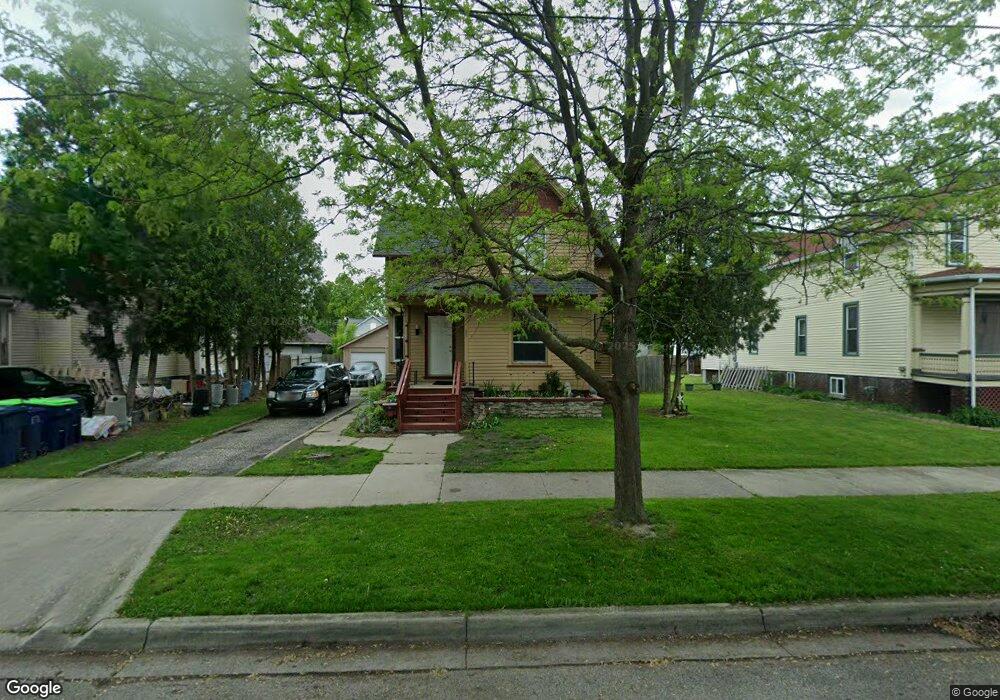
521 N Sherman St Bay City, MI 48708
Estimated Value: $94,000 - $226,765
3
Beds
2
Baths
1,454
Sq Ft
$95/Sq Ft
Est. Value
About This Home
This home is located at 521 N Sherman St, Bay City, MI 48708 and is currently estimated at $137,441, approximately $94 per square foot. 521 N Sherman St is a home located in Bay County with nearby schools including Washington Elementary School, Handy Middle School, and Bay City Central High School.
Ownership History
Date
Name
Owned For
Owner Type
Purchase Details
Closed on
Jul 20, 2022
Sold by
Zaninovich Ryan and Zaninovich Carrie
Bought by
Villanautics Llc
Current Estimated Value
Home Financials for this Owner
Home Financials are based on the most recent Mortgage that was taken out on this home.
Original Mortgage
$1,723,880
Outstanding Balance
$1,646,288
Interest Rate
5.54%
Mortgage Type
New Conventional
Estimated Equity
-$1,508,847
Purchase Details
Closed on
Nov 30, 2017
Sold by
Frank Randall L
Bought by
Zaninovich Ryan and Zaninovich Carrie
Purchase Details
Closed on
Sep 15, 2011
Sold by
Fannie Mae
Bought by
American Realty Funds Corp
Purchase Details
Closed on
Aug 20, 2010
Sold by
Patterson Michele M and Patterson Nancy F
Bought by
Federal National Mortgage Association
Purchase Details
Closed on
Sep 25, 2001
Sold by
Shannon Christopher J and Shannon Elise
Bought by
Patterson Michele M
Purchase Details
Closed on
Apr 16, 1998
Sold by
Gagnon Frederick E and Gagnon Melinda S
Bought by
Shannon Christopher J and Shannon Elise M
Create a Home Valuation Report for This Property
The Home Valuation Report is an in-depth analysis detailing your home's value as well as a comparison with similar homes in the area
Home Values in the Area
Average Home Value in this Area
Purchase History
| Date | Buyer | Sale Price | Title Company |
|---|---|---|---|
| Villanautics Llc | $79,000 | Diversified National Title | |
| Zaninovich Ryan | $822,853 | None Available | |
| American Realty Funds Corp | $13,000 | Etitle Agency Inc | |
| Federal National Mortgage Association | $64,789 | None Available | |
| Patterson Michele M | $74,500 | -- | |
| Shannon Christopher J | $42,000 | -- |
Source: Public Records
Mortgage History
| Date | Status | Borrower | Loan Amount |
|---|---|---|---|
| Open | Villanautics Llc | $1,723,880 |
Source: Public Records
Tax History Compared to Growth
Tax History
| Year | Tax Paid | Tax Assessment Tax Assessment Total Assessment is a certain percentage of the fair market value that is determined by local assessors to be the total taxable value of land and additions on the property. | Land | Improvement |
|---|---|---|---|---|
| 2025 | $3,202 | $56,800 | $0 | $0 |
| 2024 | $2,640 | $50,800 | $0 | $0 |
| 2023 | $2,514 | $44,500 | $0 | $0 |
| 2022 | $2,330 | $40,150 | $0 | $0 |
| 2021 | $2,210 | $37,700 | $37,700 | $0 |
| 2020 | $2,301 | $34,900 | $34,900 | $0 |
| 2019 | $2,259 | $33,900 | $0 | $0 |
| 2018 | $2,413 | $33,250 | $0 | $0 |
| 2017 | $2,007 | $33,850 | $0 | $0 |
| 2016 | $1,995 | $32,250 | $0 | $32,250 |
| 2015 | $1,507 | $29,500 | $0 | $29,500 |
| 2014 | $1,507 | $29,850 | $0 | $29,850 |
Source: Public Records
Map
Nearby Homes
- 510 N Farragut St
- 1010 6th Street 6th St
- 904 6th St
- 302 N Farragut St
- 234 N Farragut St
- 301 N Van Buren St
- 1213 Center Ave
- 321 N Birney St
- 909 Center Ave
- 251 N Van Buren St
- 701 Center Ave
- 1216 4th St
- 1708 6th St
- 1713 9th St
- 1517 11th St
- 1509 5th St
- 224 N Madison Ave
- 1712 10th St
- 609 11th St
- 820 N Johnson St
- 515 N Sherman St
- 525 N Sherman St
- 520 N Farragut St
- 518 N Farragut St
- 511 N Sherman St
- 609 N Sherman St
- 600 N Farragut St
- 514 N Sherman St
- 604 N Farragut St
- 506 N Sherman St
- 520 N Sherman St
- 613 N Sherman St
- 1113 Mckinley St
- 524 N Sherman St
- 1103 Mckinley St
- 608 N Farragut St
- 600 N Sherman St
- 1201 Mckinley St
- 615 N Sherman St
- 601 N Farragut St