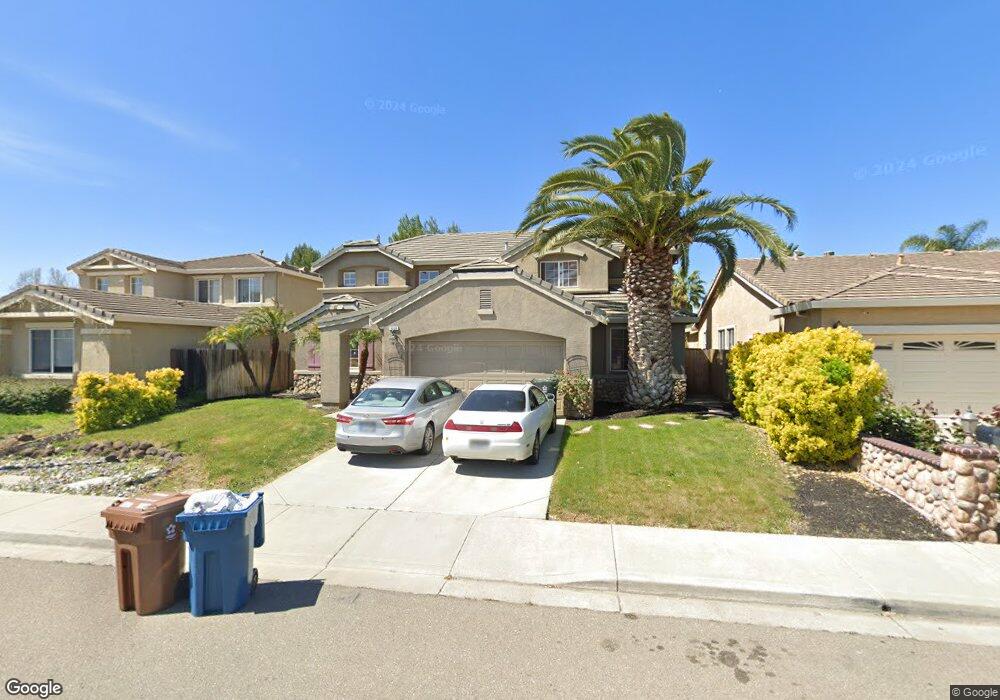
5220 Saddle Mountain Way Antioch, CA 94531
Lone Tree Valley NeighborhoodEstimated Value: $739,000 - $805,421
4
Beds
3
Baths
2,845
Sq Ft
$270/Sq Ft
Est. Value
About This Home
This home is located at 5220 Saddle Mountain Way, Antioch, CA 94531 and is currently estimated at $767,105, approximately $269 per square foot. 5220 Saddle Mountain Way is a home located in Contra Costa County with nearby schools including Lone Tree Elementary School, Dallas Ranch Middle School, and Deer Valley High School.
Ownership History
Date
Name
Owned For
Owner Type
Purchase Details
Closed on
Jul 7, 2011
Sold by
Foster Bryce T and Foster Denise N
Bought by
Foster Bryce Thomas and Foster Denise Nicole
Current Estimated Value
Purchase Details
Closed on
Feb 13, 2001
Sold by
Foster Bryce T and Foster Denise N
Bought by
Foster Bryce and Foster Denise
Home Financials for this Owner
Home Financials are based on the most recent Mortgage that was taken out on this home.
Original Mortgage
$275,000
Outstanding Balance
$99,334
Interest Rate
7.08%
Mortgage Type
Purchase Money Mortgage
Estimated Equity
$667,771
Purchase Details
Closed on
Sep 11, 2000
Sold by
Meritage Homes Of Northern Ca Inc
Bought by
Foster Bryce T and Foster Denise N
Home Financials for this Owner
Home Financials are based on the most recent Mortgage that was taken out on this home.
Original Mortgage
$252,700
Interest Rate
8.11%
Mortgage Type
Purchase Money Mortgage
Create a Home Valuation Report for This Property
The Home Valuation Report is an in-depth analysis detailing your home's value as well as a comparison with similar homes in the area
Home Values in the Area
Average Home Value in this Area
Purchase History
| Date | Buyer | Sale Price | Title Company |
|---|---|---|---|
| Foster Bryce Thomas | -- | None Available | |
| Foster Bryce | -- | First American Title Guarant | |
| Foster Bryce T | $348,000 | First American Title Guarant |
Source: Public Records
Mortgage History
| Date | Status | Borrower | Loan Amount |
|---|---|---|---|
| Open | Foster Bryce | $275,000 | |
| Closed | Foster Bryce T | $252,700 | |
| Closed | Foster Bryce T | $25,600 |
Source: Public Records
Tax History Compared to Growth
Tax History
| Year | Tax Paid | Tax Assessment Tax Assessment Total Assessment is a certain percentage of the fair market value that is determined by local assessors to be the total taxable value of land and additions on the property. | Land | Improvement |
|---|---|---|---|---|
| 2025 | $7,108 | $635,841 | $156,171 | $479,670 |
| 2024 | $6,853 | $623,374 | $153,109 | $470,265 |
| 2023 | $6,853 | $611,152 | $150,107 | $461,045 |
| 2022 | $6,743 | $599,169 | $147,164 | $452,005 |
| 2021 | $6,542 | $587,422 | $144,279 | $443,143 |
| 2019 | $6,479 | $570,000 | $140,000 | $430,000 |
| 2018 | $5,819 | $525,356 | $92,694 | $432,662 |
| 2017 | $5,620 | $507,000 | $89,456 | $417,544 |
| 2016 | $5,455 | $493,500 | $87,074 | $406,426 |
| 2015 | $5,376 | $450,500 | $79,487 | $371,013 |
| 2014 | $5,315 | $364,500 | $64,313 | $300,187 |
Source: Public Records
Map
Nearby Homes
- 5243 Delta View Way
- 1879 Mount Conness Way
- 1333 Mokelumne Dr
- 1157 Rockspring Way
- 1928 Badger Pass Way
- 1525 Barkley Mountain Way
- 5488 Southwood Ct
- 5448 Southwood Way
- 5023 Vesteny Ct
- 5106 Watkings Way
- 2401 Silveria Way
- 4959 Star Mine Ct
- 2344 Forty Niner Ct
- 1256 Mokelumne Ct
- 4925 Cache Peak Dr
- 4836 Belford Peak Way
- 5004 Star Mine Way
- 4604 Coal Hill Place
- 2133 Bamboo Way
- 5065 Carbondale Way
- 5216 Saddle Mountain Way
- 5224 Saddle Mountain Way
- 5228 Saddle Mountain Way
- 5212 Saddle Mountain Way
- 5232 Saddle Mountain Way
- 5208 Saddle Mountain Way
- 5219 Saddle Mountain Way
- 5215 Saddle Mountain Way
- 5223 Saddle Mountain Way
- 5211 Saddle Mountain Way
- 5236 Saddle Mountain Way
- 5227 Saddle Mountain Way
- 5204 Saddle Mountain Way
- 5207 Saddle Mountain Way
- 5105 Trailridge Ct
- 5109 Trailridge Ct
- 5231 Saddle Mountain Way
- 5240 Saddle Mountain Way
- 5113 Trailridge Ct
- 5200 Saddle Mountain Way