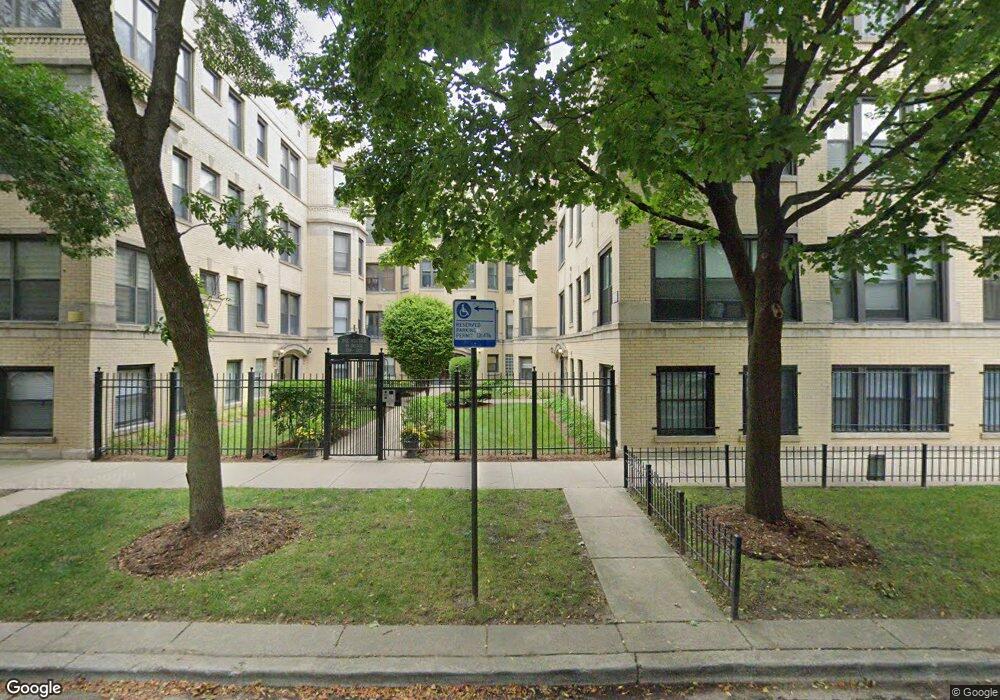
5223 S Drexel Ave Unit 52232N Chicago, IL 60615
Hyde Park NeighborhoodEstimated Value: $220,262 - $243,000
2
Beds
1
Bath
25,431
Sq Ft
$9/Sq Ft
Est. Value
About This Home
This home is located at 5223 S Drexel Ave Unit 52232N, Chicago, IL 60615 and is currently estimated at $230,816, approximately $9 per square foot. 5223 S Drexel Ave Unit 52232N is a home located in Cook County with nearby schools including Kozminski Community Academy, Kenwood Academy High School, and The Chicago Free School.
Ownership History
Date
Name
Owned For
Owner Type
Purchase Details
Closed on
Dec 9, 2015
Sold by
Fannie Mae
Bought by
Yang Hong and Jiang Hao
Current Estimated Value
Home Financials for this Owner
Home Financials are based on the most recent Mortgage that was taken out on this home.
Original Mortgage
$85,000
Outstanding Balance
$68,320
Interest Rate
4.37%
Mortgage Type
New Conventional
Estimated Equity
$162,496
Purchase Details
Closed on
Nov 24, 2014
Sold by
Leipert Trent C
Bought by
Federal National Mortgage Association
Purchase Details
Closed on
Jul 11, 2008
Sold by
Drexel Properties Llc
Bought by
Leipert Trent C
Home Financials for this Owner
Home Financials are based on the most recent Mortgage that was taken out on this home.
Original Mortgage
$153,750
Interest Rate
6.15%
Mortgage Type
Unknown
Create a Home Valuation Report for This Property
The Home Valuation Report is an in-depth analysis detailing your home's value as well as a comparison with similar homes in the area
Home Values in the Area
Average Home Value in this Area
Purchase History
| Date | Buyer | Sale Price | Title Company |
|---|---|---|---|
| Yang Hong | $120,000 | Atgf Inc | |
| Federal National Mortgage Association | -- | None Available | |
| Leipert Trent C | $205,000 | Chicago Title Insurance Co |
Source: Public Records
Mortgage History
| Date | Status | Borrower | Loan Amount |
|---|---|---|---|
| Open | Yang Hong | $85,000 | |
| Previous Owner | Leipert Trent C | $153,750 |
Source: Public Records
Tax History Compared to Growth
Tax History
| Year | Tax Paid | Tax Assessment Tax Assessment Total Assessment is a certain percentage of the fair market value that is determined by local assessors to be the total taxable value of land and additions on the property. | Land | Improvement |
|---|---|---|---|---|
| 2024 | $3,599 | $19,911 | $3,574 | $16,337 |
| 2023 | $3,496 | $17,000 | $2,882 | $14,118 |
| 2022 | $3,496 | $17,000 | $2,882 | $14,118 |
| 2021 | $3,418 | $16,999 | $2,882 | $14,117 |
| 2020 | $2,589 | $11,620 | $2,305 | $9,315 |
| 2019 | $2,542 | $12,654 | $2,305 | $10,349 |
| 2018 | $2,500 | $12,654 | $2,305 | $10,349 |
| 2017 | $2,370 | $11,010 | $1,902 | $9,108 |
| 2016 | $2,205 | $11,010 | $1,902 | $9,108 |
| 2015 | $2,018 | $11,010 | $1,902 | $9,108 |
| 2014 | $2,104 | $11,338 | $1,556 | $9,782 |
| 2013 | $2,062 | $11,338 | $1,556 | $9,782 |
Source: Public Records
Map
Nearby Homes
- 5223 S Drexel Ave Unit 2N
- 5239 S Ingleside Ave
- 5132 S Drexel Ave Unit 2D
- 5200 S Ellis Ave Unit 202
- 5200 S Ellis Ave Unit 508
- 5252 S Drexel Ave Unit 3A
- 5118 S Ingleside Ave Unit A
- 5107 S Ingleside Ave Unit 3
- 1000 E 53rd St Unit 119S
- 945 E Hyde Park Blvd Unit 2
- 947 E Hyde Park Blvd Unit G
- 5052 S Drexel Blvd Unit 3C
- 1006 E 54th St Unit J-2
- 5142 S Greenwood Ave Unit 1
- 5133 S Greenwood Ave Unit 2
- 5230 S University Ave Unit D
- 1036 E Hyde Park Blvd
- 1059 E Hyde Park Blvd Unit 1
- 5459 S Ingleside Ave Unit 5459
- 5455 S Ingleside Ave Unit 5455
- 5223 S Drexel Ave Unit 52233S
- 5223 S Drexel Ave Unit 52232S
- 5223 S Drexel Ave Unit 52231S
- 5223 S Drexel Ave Unit 52233N
- 5223 S Drexel Ave Unit 52231N
- 5223 S Drexel Ave Unit 1N
- 5223 S Drexel Ave Unit 3N
- 5223 S Drexel Ave Unit 3S
- 5223 S Drexel Ave Unit 2S
- 5223 S Drexel Ave Unit 1S
- 5227 S Drexel Ave Unit 52273
- 5227 S Drexel Ave Unit 52272
- 5227 S Drexel Ave Unit 52271
- 5227 S Drexel Ave Unit 5227G
- 5227 S Drexel Ave Unit G
- 5227 S Drexel Ave Unit 1
- 5227 S Drexel Ave Unit 2
- 5227 S Drexel Ave Unit 2S
- 5227 S Drexel Ave Unit 3S
- 5225 S Drexel Ave