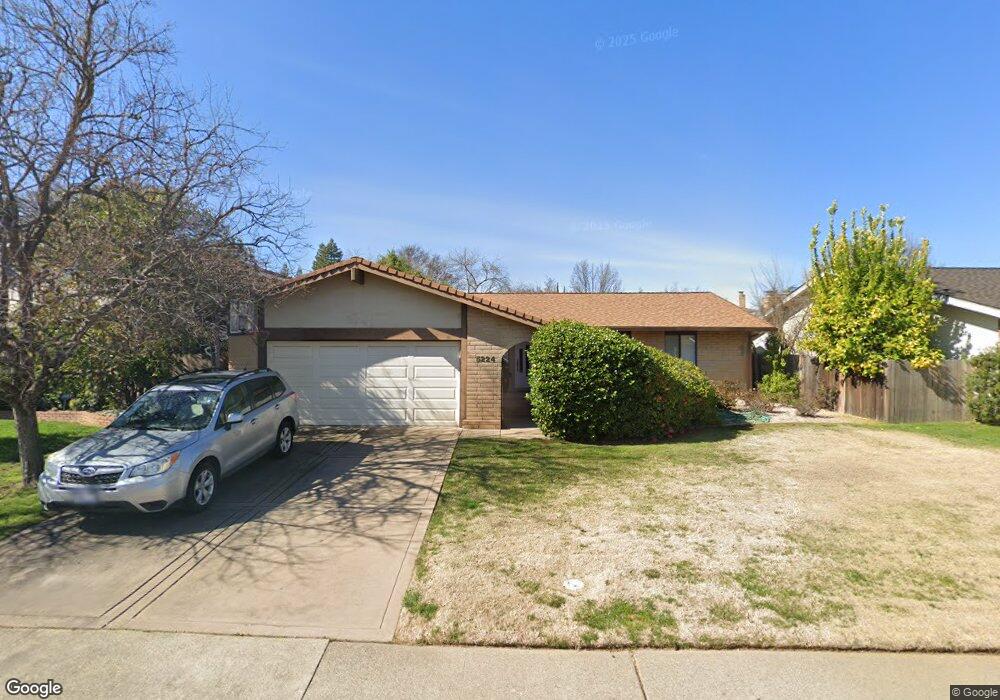
5224 Marimoore Way Carmichael, CA 95608
Wilhaggin del Dayo NeighborhoodEstimated Value: $372,000 - $759,000
3
Beds
2
Baths
1,465
Sq Ft
$432/Sq Ft
Est. Value
About This Home
This home is located at 5224 Marimoore Way, Carmichael, CA 95608 and is currently estimated at $632,685, approximately $431 per square foot. 5224 Marimoore Way is a home located in Sacramento County with nearby schools including Del Dayo Elementary School, Arden Middle School, and Rio Americano High School.
Ownership History
Date
Name
Owned For
Owner Type
Purchase Details
Closed on
Apr 4, 2011
Sold by
Harling Paul R and The 1998 Harling Family Trust
Bought by
Soriano Bonnie L
Current Estimated Value
Home Financials for this Owner
Home Financials are based on the most recent Mortgage that was taken out on this home.
Original Mortgage
$330,406
Outstanding Balance
$228,695
Interest Rate
4.87%
Mortgage Type
FHA
Estimated Equity
$403,990
Purchase Details
Closed on
Jan 15, 1998
Sold by
Lynn Harling Paul R and Lynn Susan
Bought by
Harling Paul R and Harling Susan L
Purchase Details
Closed on
Nov 22, 1993
Sold by
Harling Paul R and Harling Susan Lynn
Bought by
Harling Paul R and Harling Susan Lynn
Home Financials for this Owner
Home Financials are based on the most recent Mortgage that was taken out on this home.
Original Mortgage
$55,000
Interest Rate
6.85%
Create a Home Valuation Report for This Property
The Home Valuation Report is an in-depth analysis detailing your home's value as well as a comparison with similar homes in the area
Home Values in the Area
Average Home Value in this Area
Purchase History
| Date | Buyer | Sale Price | Title Company |
|---|---|---|---|
| Soriano Bonnie L | $339,000 | Old Republic Title Company | |
| Harling Paul R | -- | -- | |
| Harling Paul R | -- | North American Title Co Inc |
Source: Public Records
Mortgage History
| Date | Status | Borrower | Loan Amount |
|---|---|---|---|
| Open | Soriano Bonnie L | $330,406 | |
| Previous Owner | Harling Paul R | $55,000 |
Source: Public Records
Tax History Compared to Growth
Tax History
| Year | Tax Paid | Tax Assessment Tax Assessment Total Assessment is a certain percentage of the fair market value that is determined by local assessors to be the total taxable value of land and additions on the property. | Land | Improvement |
|---|---|---|---|---|
| 2025 | $5,289 | $434,304 | $192,170 | $242,134 |
| 2024 | $5,289 | $425,789 | $188,402 | $237,387 |
| 2023 | $5,157 | $417,441 | $184,708 | $232,733 |
| 2022 | $5,129 | $409,257 | $181,087 | $228,170 |
| 2021 | $5,046 | $401,234 | $177,537 | $223,697 |
| 2020 | $4,954 | $397,121 | $175,717 | $221,404 |
| 2019 | $4,857 | $389,335 | $172,272 | $217,063 |
| 2018 | $4,772 | $381,702 | $168,895 | $212,807 |
| 2017 | $4,756 | $374,219 | $165,584 | $208,635 |
| 2016 | $4,440 | $366,883 | $162,338 | $204,545 |
| 2015 | $4,365 | $361,373 | $159,900 | $201,473 |
| 2014 | $4,939 | $354,295 | $156,768 | $197,527 |
Source: Public Records
Map
Nearby Homes
- 5021 Jardin Ln
- 1540 Gregory Way
- 1626 Arden Bluffs Ln
- 1325 Philomene Ct
- 4935 Fair Oaks Blvd
- 1360 Pars Oak Ln
- 1744 Haggin Grove Way
- 1389 Pars Oak Ln
- 1749 Haggin Grove Way
- 1625 Gary Way
- 1510 Barnett Cir
- 9730 Mira Del Rio Dr
- 5312 Retreat Way
- 868 Wixford Way
- 4611 Fair Oaks Blvd
- 9648 Linda Rio Dr
- 9801 Mira Del Rio Dr
- 1508 Joby Ln
- 9815 Mira Del Rio Dr
- 2400 E Tiffany Ln
- 5228 Marimoore Way
- 5220 Marimoore Way
- 5242 Shelato Way
- 5246 Shelato Way
- 5232 Marimoore Way
- 5216 Marimoore Way
- 5225 Marimoore Way
- 5238 Shelato Way
- 5250 Shelato Way
- 5221 Marimoore Way
- 5229 Marimoore Way
- 5217 Marimoore Way
- 5233 Marimoore Way
- 5236 Marimoore Way
- 5234 Shelato Way
- 5213 Marimoore Way
- 5245 Shelato Way
- 5335 Marimoore Way
- 1281 Los Rios Dr
- 5249 Shelato Way