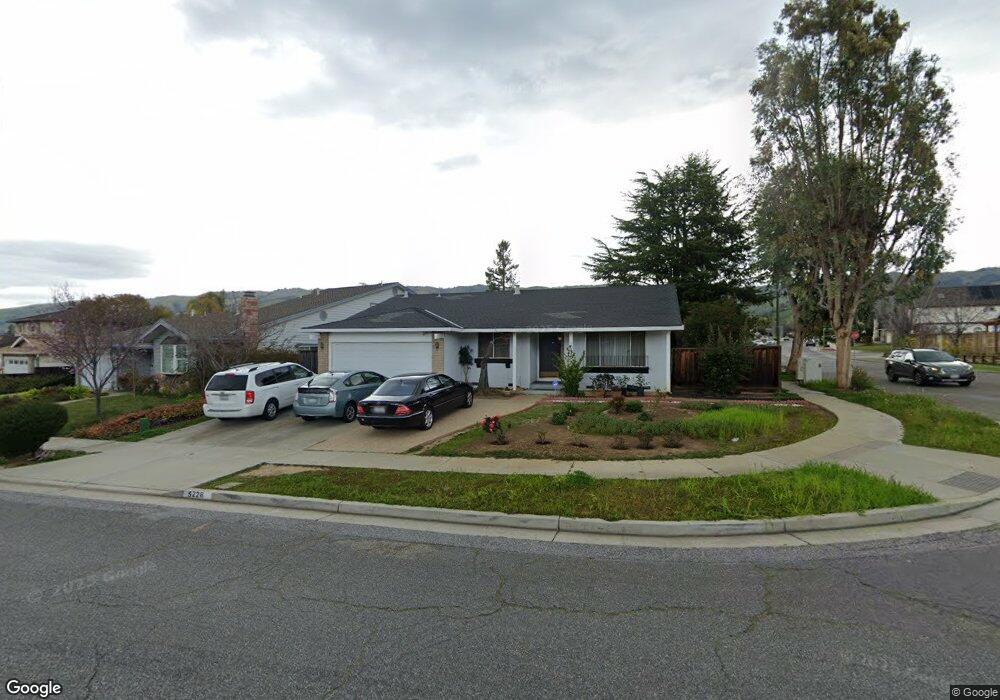
5228 Shadow Estate San Jose, CA 95135
Evergreen Estates NeighborhoodEstimated Value: $1,671,824 - $1,901,000
3
Beds
2
Baths
1,622
Sq Ft
$1,082/Sq Ft
Est. Value
About This Home
This home is located at 5228 Shadow Estate, San Jose, CA 95135 and is currently estimated at $1,755,206, approximately $1,082 per square foot. 5228 Shadow Estate is a home located in Santa Clara County with nearby schools including Tom Matsumoto Elementary School, Chaboya Middle School, and Silver Creek High School.
Ownership History
Date
Name
Owned For
Owner Type
Purchase Details
Closed on
Aug 8, 2003
Sold by
Perveen Rukhsana
Bought by
Saleem Mohammad
Current Estimated Value
Home Financials for this Owner
Home Financials are based on the most recent Mortgage that was taken out on this home.
Original Mortgage
$400,000
Outstanding Balance
$171,905
Interest Rate
5.29%
Mortgage Type
Purchase Money Mortgage
Estimated Equity
$1,583,301
Purchase Details
Closed on
Nov 17, 2001
Sold by
Douglas Lise G
Bought by
Douglas Lise G
Purchase Details
Closed on
Jul 30, 1999
Sold by
Douglas Robert E
Bought by
Douglas Lise G
Home Financials for this Owner
Home Financials are based on the most recent Mortgage that was taken out on this home.
Original Mortgage
$155,000
Interest Rate
7.89%
Mortgage Type
Stand Alone First
Purchase Details
Closed on
Oct 14, 1996
Sold by
Douglas Robert E and Douglas Lise G
Bought by
Douglas Lise G
Create a Home Valuation Report for This Property
The Home Valuation Report is an in-depth analysis detailing your home's value as well as a comparison with similar homes in the area
Home Values in the Area
Average Home Value in this Area
Purchase History
| Date | Buyer | Sale Price | Title Company |
|---|---|---|---|
| Saleem Mohammad | -- | Chicago Title | |
| Saleem Mohammad | -- | Chicago Title | |
| Douglas Lise G | -- | -- | |
| Douglas Lise G | -- | Chicago Title Co | |
| Douglas Lise G | -- | -- |
Source: Public Records
Mortgage History
| Date | Status | Borrower | Loan Amount |
|---|---|---|---|
| Open | Saleem Mohammad | $400,000 | |
| Previous Owner | Douglas Lise G | $155,000 |
Source: Public Records
Tax History Compared to Growth
Tax History
| Year | Tax Paid | Tax Assessment Tax Assessment Total Assessment is a certain percentage of the fair market value that is determined by local assessors to be the total taxable value of land and additions on the property. | Land | Improvement |
|---|---|---|---|---|
| 2025 | $10,581 | $724,740 | $289,893 | $434,847 |
| 2024 | $10,581 | $710,530 | $284,209 | $426,321 |
| 2023 | $10,581 | $696,599 | $278,637 | $417,962 |
| 2022 | $10,322 | $682,941 | $273,174 | $409,767 |
| 2021 | $10,134 | $669,551 | $267,818 | $401,733 |
| 2020 | $9,694 | $662,686 | $265,072 | $397,614 |
| 2019 | $9,447 | $649,693 | $259,875 | $389,818 |
| 2018 | $9,350 | $636,955 | $254,780 | $382,175 |
| 2017 | $9,200 | $624,467 | $249,785 | $374,682 |
| 2016 | $8,771 | $612,224 | $244,888 | $367,336 |
| 2015 | $8,654 | $603,029 | $241,210 | $361,819 |
| 2014 | $7,974 | $591,218 | $236,486 | $354,732 |
Source: Public Records
Map
Nearby Homes
- 5277 Knights Estate
- 5274 Sunny Orchard Ln
- 5213 Silvercrest Ridge Ct
- 2051 Folle Blanche Dr Unit 2051
- 2044 Folle Blanche Dr Unit 2044
- 2010 Carignan Way
- 3123 Lake Trasimeno Dr
- 5424 Cribari Ct
- 3308 Lake Albano Cir
- 5336 Cribari Glen
- 5437 Cribari Green
- 5271 Cribari Corner
- 5302 Cribari Heights
- 5469 Cribari Green
- 5286 Cribari Heights Unit A286
- 5264 Cribari Heights
- 5235 Cribari Hills
- 5142 Cribari Place
- 5189 Cribari Hills
- 5310 Rachaella Ln
- 5224 Shadow Estate
- 2903 Silver Estate
- 5218 Shadow Estate
- 5206 Silverwood Creek Ct
- 2911 Silver Estate
- 5251 Knights Estate
- 5229 Shadow Estate
- 5225 Shadow Estate
- 5214 Shadow Estate
- 5221 Shadow Estate
- 5255 Knights Estate
- 5212 Silverwood Creek Ct
- 5167 Sunny Creek Place
- 2919 Silver Estate
- 5217 Shadow Estate
- 2869 Silver Estate
- 5169 Sunny Creek Place
- 5210 Shadow Estate
- 5259 Knights Estate
- 5259 Knights Estates