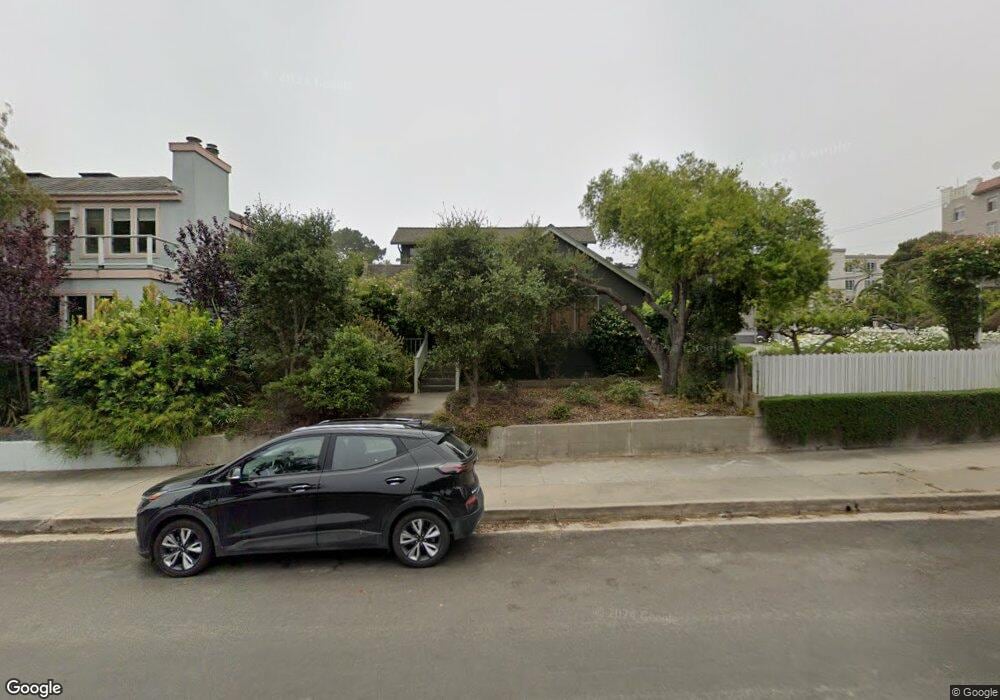
523 Gibson Ave Pacific Grove, CA 93950
Estimated Value: $1,167,000 - $1,439,000
1
Bed
1
Bath
758
Sq Ft
$1,687/Sq Ft
Est. Value
About This Home
This home is located at 523 Gibson Ave, Pacific Grove, CA 93950 and is currently estimated at $1,278,450, approximately $1,686 per square foot. 523 Gibson Ave is a home located in Monterey County with nearby schools including Robert Down Elementary School, Pacific Grove Middle School, and Pacific Grove High School.
Ownership History
Date
Name
Owned For
Owner Type
Purchase Details
Closed on
Mar 14, 2018
Sold by
Albert Steven B and Albert Mary S
Bought by
Albert Steven B and Albert Mary S
Current Estimated Value
Purchase Details
Closed on
Oct 20, 2009
Sold by
Hurd Shirley D
Bought by
Albert Steven B and Albert Mary S
Home Financials for this Owner
Home Financials are based on the most recent Mortgage that was taken out on this home.
Original Mortgage
$414,400
Outstanding Balance
$270,182
Interest Rate
5.05%
Mortgage Type
New Conventional
Estimated Equity
$1,008,268
Create a Home Valuation Report for This Property
The Home Valuation Report is an in-depth analysis detailing your home's value as well as a comparison with similar homes in the area
Home Values in the Area
Average Home Value in this Area
Purchase History
| Date | Buyer | Sale Price | Title Company |
|---|---|---|---|
| Albert Steven B | -- | None Available | |
| Albert Steven B | $518,000 | Chicago Title Company |
Source: Public Records
Mortgage History
| Date | Status | Borrower | Loan Amount |
|---|---|---|---|
| Open | Albert Steven B | $414,400 |
Source: Public Records
Tax History Compared to Growth
Tax History
| Year | Tax Paid | Tax Assessment Tax Assessment Total Assessment is a certain percentage of the fair market value that is determined by local assessors to be the total taxable value of land and additions on the property. | Land | Improvement |
|---|---|---|---|---|
| 2025 | $7,809 | $752,162 | $516,324 | $235,838 |
| 2024 | $7,809 | $737,414 | $506,200 | $231,214 |
| 2023 | $7,908 | $722,956 | $496,275 | $226,681 |
| 2022 | $7,747 | $708,782 | $486,545 | $222,237 |
| 2021 | $7,705 | $694,885 | $477,005 | $217,880 |
| 2020 | $7,550 | $687,760 | $472,114 | $215,646 |
| 2019 | $7,309 | $674,275 | $462,857 | $211,418 |
| 2018 | $7,162 | $661,055 | $453,782 | $207,273 |
| 2017 | $7,044 | $648,094 | $444,885 | $203,209 |
| 2016 | $7,060 | $635,387 | $436,162 | $199,225 |
| 2015 | $6,944 | $625,844 | $429,611 | $196,233 |
| 2014 | $6,375 | $575,447 | $421,196 | $154,251 |
Source: Public Records
Map
Nearby Homes
- 618 Forest Ave
- 515 13th St
- 414 Sinex Ave
- 917 Fountain Ave
- 405 Carmel Ave
- 820 - 822 Cedar St
- 723 Eardley Ave
- 406 10th St
- 700 Rosemont Ave
- 306 9th St
- 224 16th St
- 309 Congress Ave
- 302 Park St
- 765 Gibson Ave
- 879 Lottie St
- 520 Lighthouse Ave Unit 301
- 311 Lobos Ave
- 155 12th St
- 791 Spruce Ave
- 815 Taylor St