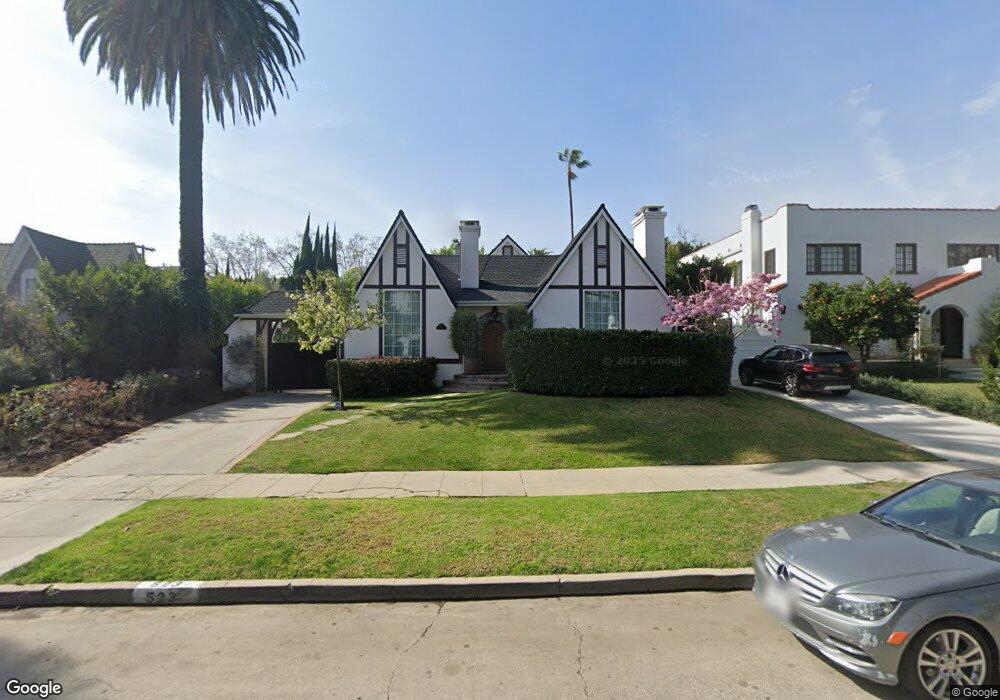
523 Lillian Way Los Angeles, CA 90004
Hancock Park NeighborhoodEstimated Value: $2,744,000 - $3,481,610
3
Beds
2
Baths
3,326
Sq Ft
$934/Sq Ft
Est. Value
About This Home
This home is located at 523 Lillian Way, Los Angeles, CA 90004 and is currently estimated at $3,105,653, approximately $933 per square foot. 523 Lillian Way is a home located in Los Angeles County with nearby schools including Third Street Elementary School, Hubert Howe Bancroft Middle School, and Fairfax High School.
Ownership History
Date
Name
Owned For
Owner Type
Purchase Details
Closed on
Oct 30, 2006
Sold by
Ghobrial Emad
Bought by
Ghobrial Emad Ayyad and George Ghobrial Amanda Jane
Current Estimated Value
Purchase Details
Closed on
Dec 3, 2002
Sold by
Ghobrial Emad
Bought by
Ghobrial Emad and George Amanda
Purchase Details
Closed on
Jun 6, 2002
Sold by
Apellan Vahe J
Bought by
Ghobrial Emad
Home Financials for this Owner
Home Financials are based on the most recent Mortgage that was taken out on this home.
Original Mortgage
$540,000
Interest Rate
5.37%
Purchase Details
Closed on
Feb 2, 1999
Sold by
Apelian Suzanne K
Bought by
Apelian Vahe J and Apelian Suzanne K
Home Financials for this Owner
Home Financials are based on the most recent Mortgage that was taken out on this home.
Original Mortgage
$240,000
Interest Rate
6.7%
Purchase Details
Closed on
Dec 9, 1997
Sold by
Kirianoff Anna
Bought by
Apelian Suzanne K
Create a Home Valuation Report for This Property
The Home Valuation Report is an in-depth analysis detailing your home's value as well as a comparison with similar homes in the area
Home Values in the Area
Average Home Value in this Area
Purchase History
| Date | Buyer | Sale Price | Title Company |
|---|---|---|---|
| Ghobrial Emad Ayyad | -- | None Available | |
| Ghobrial Emad | -- | -- | |
| Ghobrial Emad | $675,000 | First American Title Co | |
| Apelian Vahe J | -- | Old Republic Title Company | |
| Apelian Suzanne K | -- | -- |
Source: Public Records
Mortgage History
| Date | Status | Borrower | Loan Amount |
|---|---|---|---|
| Previous Owner | Ghobrial Emad | $540,000 | |
| Previous Owner | Apelian Vahe J | $240,000 |
Source: Public Records
Tax History Compared to Growth
Tax History
| Year | Tax Paid | Tax Assessment Tax Assessment Total Assessment is a certain percentage of the fair market value that is determined by local assessors to be the total taxable value of land and additions on the property. | Land | Improvement |
|---|---|---|---|---|
| 2025 | $16,111 | $1,323,446 | $797,736 | $525,710 |
| 2024 | $16,111 | $1,297,497 | $782,095 | $515,402 |
| 2023 | $15,806 | $1,272,057 | $766,760 | $505,297 |
| 2022 | $15,083 | $1,247,116 | $751,726 | $495,390 |
| 2021 | $14,888 | $1,222,664 | $736,987 | $485,677 |
| 2019 | $14,447 | $1,186,401 | $715,129 | $471,272 |
| 2018 | $14,311 | $1,163,139 | $701,107 | $462,032 |
| 2016 | $13,674 | $1,117,975 | $673,883 | $444,092 |
| 2015 | $13,476 | $1,101,183 | $663,761 | $437,422 |
| 2014 | $13,520 | $1,079,613 | $650,759 | $428,854 |
Source: Public Records
Map
Nearby Homes
- 532 N Rossmore Ave Unit 107
- 585 N Rossmore Ave Unit 407
- 585 N Rossmore Ave Unit 409
- 565 N Arden Blvd
- 626 N Cahuenga Blvd
- 536 N Arden Blvd
- 624 Wilcox Ave Unit 1/2
- 640 Lillian Way
- 347 N Arden Blvd
- 424 N Arden Blvd
- 507 N Lucerne Blvd
- 651 Wilcox Ave Unit 3G
- 647 Wilcox Ave Unit 2G
- 309 N Arden Blvd
- 6017 Melrose Ave
- 543 N June St
- 322 N June St
- 5725 Melrose Ave
- 738 N Hudson Ave
- 588 N Gower St
- 531 Lillian Way
- 515 Lillian Way
- 535 Lillian Way
- 511 Lillian Way
- 524 N Cahuenga Blvd
- 530 N Cahuenga Blvd
- 514 N Cahuenga Blvd
- 541 Lillian Way
- 534 N Cahuenga Blvd
- 510 N Cahuenga Blvd
- 501 Lillian Way
- 524 Lillian Way
- 520 Lillian Way
- 530 Lillian Way
- 514 Lillian Way
- 514 Lillian Way
- 540 N Cahuenga Blvd
- 545 Lillian Way
- 534 Lillian Way
- 510 Lillian Way