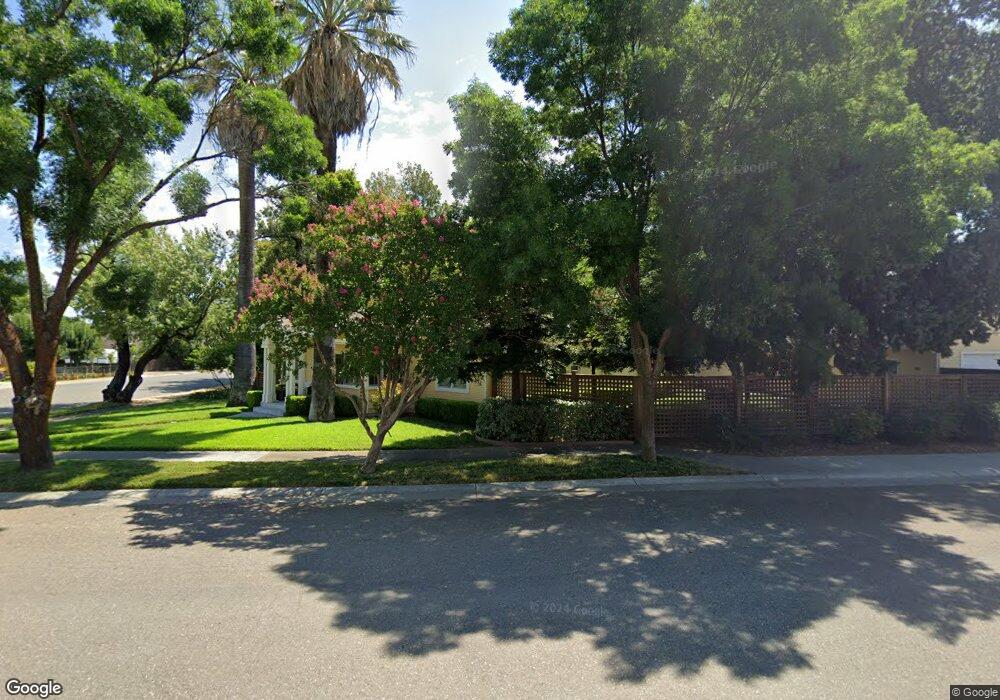
523 Walnut St Corning, CA 96021
Estimated Value: $213,000 - $296,000
2
Beds
1
Bath
1,658
Sq Ft
$160/Sq Ft
Est. Value
About This Home
This home is located at 523 Walnut St, Corning, CA 96021 and is currently estimated at $264,895, approximately $159 per square foot. 523 Walnut St is a home located in Tehama County with nearby schools including Olive View Elementary School, Maywood Middle School, and Corning High School.
Ownership History
Date
Name
Owned For
Owner Type
Purchase Details
Closed on
May 20, 2020
Sold by
Franer Timothy Marvin and Greer Franer Janice
Bought by
Franer Timothy Marvin and Greer Franer Janice
Current Estimated Value
Home Financials for this Owner
Home Financials are based on the most recent Mortgage that was taken out on this home.
Original Mortgage
$157,300
Interest Rate
2.7%
Mortgage Type
New Conventional
Purchase Details
Closed on
Mar 9, 2020
Sold by
Greer Franer Janice and Franer Timothy Marvin
Bought by
Franer Timothy Marvin and Greer Franer Janice
Purchase Details
Closed on
Sep 28, 2010
Sold by
Greer Franer Janice L and Greer Franer Janice
Bought by
Franer Timothy M and Greer Franer Janice L
Home Financials for this Owner
Home Financials are based on the most recent Mortgage that was taken out on this home.
Original Mortgage
$112,500
Interest Rate
4.28%
Mortgage Type
New Conventional
Purchase Details
Closed on
May 7, 2001
Sold by
Salado Daniel August
Bought by
Salado Janice Louise
Create a Home Valuation Report for This Property
The Home Valuation Report is an in-depth analysis detailing your home's value as well as a comparison with similar homes in the area
Purchase History
| Date | Buyer | Sale Price | Title Company |
|---|---|---|---|
| Franer Timothy Marvin | -- | None Available | |
| Franer Timothy Marvin | -- | Amrock Inc | |
| Franer Timothy Marvin | -- | None Available | |
| Farner Timothy Marvin | -- | None Available | |
| Franer Timothy M | -- | Lsi | |
| Salado Janice Louise | -- | -- |
Source: Public Records
Mortgage History
| Date | Status | Borrower | Loan Amount |
|---|---|---|---|
| Previous Owner | Franer Timothy Marvin | $157,300 | |
| Previous Owner | Franer Timothy M | $112,500 |
Source: Public Records
Tax History
| Year | Tax Paid | Tax Assessment Tax Assessment Total Assessment is a certain percentage of the fair market value that is determined by local assessors to be the total taxable value of land and additions on the property. | Land | Improvement |
|---|---|---|---|---|
| 2025 | $1,237 | $126,708 | $42,240 | $84,468 |
| 2023 | $1,212 | $121,789 | $40,600 | $81,189 |
| 2022 | $1,193 | $119,402 | $39,804 | $79,598 |
| 2021 | $1,075 | $110,062 | $39,024 | $71,038 |
| 2020 | $556 | $58,865 | $9,340 | $49,525 |
| 2019 | $532 | $57,711 | $9,157 | $48,554 |
| 2018 | $531 | $56,580 | $8,978 | $47,602 |
| 2017 | $526 | $55,471 | $8,802 | $46,669 |
| 2016 | $490 | $54,384 | $8,630 | $45,754 |
Source: Public Records
Map
Nearby Homes
Your Personal Tour Guide
Ask me questions while you tour the home.