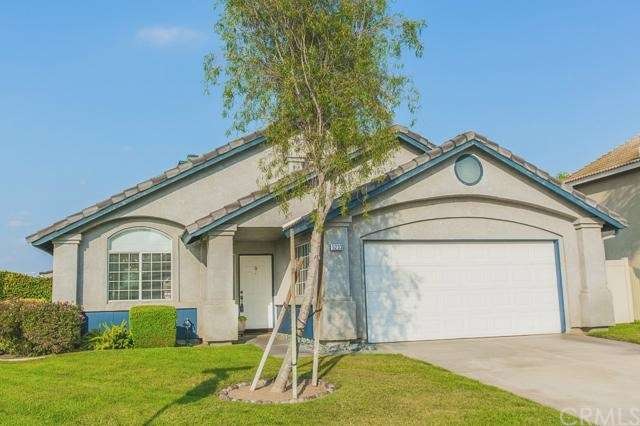
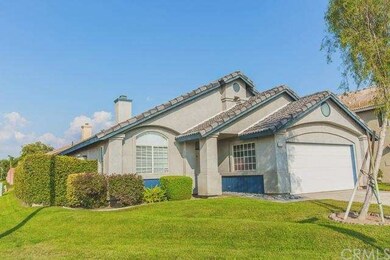

5233 Sierra Cross Way Riverside, CA 92509
Highlights
- Cathedral Ceiling
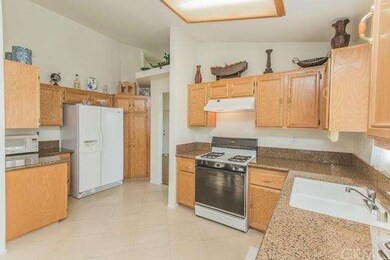
- Granite Countertops
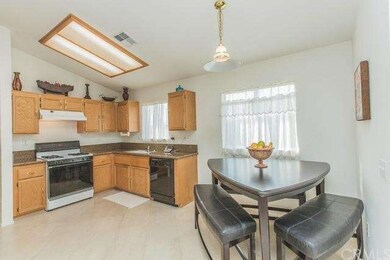
- Breakfast Area or Nook
- Corner Lot
- Outdoor Cooking Area
- 2 Car Attached Garage
About This Home
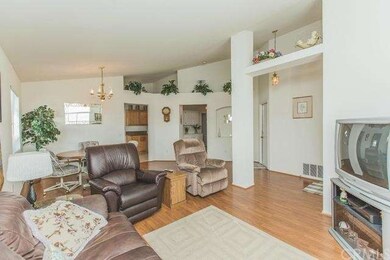
As of August 2020Turnkey single story home in beautiful Loring Ranch on a corner lot. Interior features vaulted ceilings for a spacious feel and beautiful wood floors. Kitchen is open to family room and has granite counter tops and plenty of storage. Master bedroom has beautiful french doors leading to rear yard, a walk-in closet and double sinks for added convenience. Family room has fireplace and french doors leading to low maintenance yard with desert landscaping. Rear yard also has gas plumbed BBQ and new vinyl fencing. Two storage sheds on side yard stay. ALSO INCLUDED: Refrigerator, wash and dryer!! Great family neighborhood with sports park close by.
Last Buyer's Agent
JOSHUA BYERLY
UNITED REALTY CENTER INC License #01407046
Home Details
Home Type
- Single Family
Est. Annual Taxes
- $4,693
Year Built
- Built in 1994
Lot Details
- 5,227 Sq Ft Lot
- Vinyl Fence
- Redwood Fence
- Corner Lot
- Front Yard
HOA Fees
- $40 Monthly HOA Fees
Parking
- 2 Car Attached Garage
Home Design
- Turnkey
- Tile Roof
Interior Spaces
- 1,496 Sq Ft Home
- Cathedral Ceiling
- Fireplace With Gas Starter
- Double Pane Windows
- French Doors
- Family Room with Fireplace
- Living Room
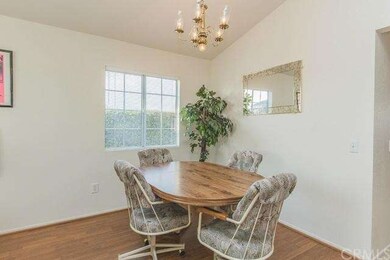
- Dining Room
Kitchen
- Breakfast Area or Nook
- Eat-In Kitchen
- Gas Range
- Microwave
- Dishwasher
- Granite Countertops
- Disposal
Flooring
- Carpet
- Laminate
Bedrooms and Bathrooms
- 3 Bedrooms
- 2 Full Bathrooms
Laundry
- Laundry Room
- Laundry in Garage
- Gas Dryer Hookup
Outdoor Features
- Tile Patio or Porch
- Exterior Lighting
Utilities
- Forced Air Heating and Cooling System
- Heating System Uses Natural Gas
Listing and Financial Details
- Tax Lot 135
- Tax Tract Number 23395
- Assessor Parcel Number 181352033
Community Details
Overview
- Loring Ranch Association, Phone Number (951) 354-5365
Amenities
- Outdoor Cooking Area
- Picnic Area
Recreation
- Community Playground
- Horse Trails
Ownership History
Purchase Details
Home Financials for this Owner
Home Financials are based on the most recent Mortgage that was taken out on this home.Purchase Details
Home Financials for this Owner
Home Financials are based on the most recent Mortgage that was taken out on this home.Purchase Details
Home Financials for this Owner
Home Financials are based on the most recent Mortgage that was taken out on this home.Purchase Details
Purchase Details
Home Financials for this Owner
Home Financials are based on the most recent Mortgage that was taken out on this home.Map
Home Values in the Area
Average Home Value in this Area
Purchase History
| Date | Type | Sale Price | Title Company |
|---|---|---|---|
| Grant Deed | $400,000 | First American Title Company | |
| Grant Deed | $340,000 | Ticor Title Company | |
| Grant Deed | $299,000 | Lawyers Title | |
| Interfamily Deed Transfer | -- | None Available | |
| Grant Deed | $116,000 | First American Title Ins Co |
Mortgage History
| Date | Status | Loan Amount | Loan Type |
|---|---|---|---|
| Open | $380,000 | New Conventional | |
| Previous Owner | $333,841 | FHA | |
| Previous Owner | $290,638 | FHA | |
| Previous Owner | $87,000 | Unknown | |
| Previous Owner | $92,750 | Purchase Money Mortgage |
Property History
| Date | Event | Price | Change | Sq Ft Price |
|---|---|---|---|---|
| 08/27/2020 08/27/20 | Sold | $400,000 | -1.7% | $267 / Sq Ft |
| 07/03/2020 07/03/20 | Pending | -- | -- | -- |
| 07/02/2020 07/02/20 | Price Changed | $406,880 | -1.9% | $272 / Sq Ft |
| 06/20/2020 06/20/20 | For Sale | $414,900 | +22.0% | $277 / Sq Ft |
| 07/12/2017 07/12/17 | Sold | $340,000 | -2.7% | $227 / Sq Ft |
| 05/25/2017 05/25/17 | For Sale | $349,500 | +16.9% | $234 / Sq Ft |
| 07/08/2015 07/08/15 | Sold | $299,000 | -0.3% | $200 / Sq Ft |
| 05/27/2015 05/27/15 | Pending | -- | -- | -- |
| 05/19/2015 05/19/15 | For Sale | $300,000 | -- | $201 / Sq Ft |
Tax History
| Year | Tax Paid | Tax Assessment Tax Assessment Total Assessment is a certain percentage of the fair market value that is determined by local assessors to be the total taxable value of land and additions on the property. | Land | Improvement |
|---|---|---|---|---|
| 2023 | $4,693 | $416,160 | $72,828 | $343,332 |
| 2022 | $4,597 | $408,000 | $71,400 | $336,600 |
| 2021 | $4,572 | $400,000 | $70,000 | $330,000 |
| 2020 | $4,057 | $353,736 | $62,424 | $291,312 |
| 2019 | $3,976 | $346,800 | $61,200 | $285,600 |
| 2018 | $3,848 | $340,000 | $60,000 | $280,000 |
| 2017 | $3,413 | $304,980 | $51,000 | $253,980 |
| 2016 | $3,365 | $299,000 | $50,000 | $249,000 |
| 2015 | $2,224 | $164,023 | $48,068 | $115,955 |
| 2014 | $2,210 | $160,812 | $47,127 | $113,685 |
Source: California Regional Multiple Listing Service (CRMLS)
MLS Number: IV15108487
APN: 181-352-033
Disclaimer: Certain information contained herein is derived from information provided by parties other than Homes.com. All information provided is deemed reliable, but is not guaranteed to be accurate and should be independently verified.
![]() The multiple listing data appearing on this website, or contained in reports produced therefrom, is owned and copyrighted by California Regional Multiple Listing Service, Inc. ("CRMLS") and is protected by all applicable copyright laws. Information provided is for viewer's personal, non-commercial use and may not be used for any purpose other than to identify prospective properties the viewer may be interested in purchasing. All listing data, including but not limited to square footage and lot size is believed to be accurate, but the listing Agent, listing Broker and CRMLS and its affiliates do not warrant or guarantee such accuracy. The viewer should independently verify the listed data prior to making any decisions based on such information by personal inspection and/or contacting a real estate professional.
The multiple listing data appearing on this website, or contained in reports produced therefrom, is owned and copyrighted by California Regional Multiple Listing Service, Inc. ("CRMLS") and is protected by all applicable copyright laws. Information provided is for viewer's personal, non-commercial use and may not be used for any purpose other than to identify prospective properties the viewer may be interested in purchasing. All listing data, including but not limited to square footage and lot size is believed to be accurate, but the listing Agent, listing Broker and CRMLS and its affiliates do not warrant or guarantee such accuracy. The viewer should independently verify the listed data prior to making any decisions based on such information by personal inspection and/or contacting a real estate professional.
Based on information from California Regional Multiple Listing Service, Inc. and /or other sources. All data, including all measurements and calculations of area, is obtained from various sources and has not been, and will not be, verified by broker or MLS. All information should be independently reviewed and verified for accuracy. Properties may or may not be listed by the office/agent presenting the information
- 5166 Contay Way
- 3825 Crestmore Rd Unit 426
- 3825 Crestmore Rd Unit 450
- 3825 Crestmore Rd Unit 412
- 4258 Hidatsa St
- 5374 Mission Rock Way
- 3883 Wallace St
- 5442 Mission Blvd
- 5244 Holstein Way
- 5154 34th St
- 3911 Pontiac Ave
- 5479 34th St
- 5479 34th St Unit 2
- 0 Mission Blvd Unit PW24252396
- 0 Mission Blvd Unit IV23139894
- 5754 Tilton Ave
- 4254 Miramonte Place
- 3715 Avalon St
- 0 42nd St
- 5683 Green Pasture Rd