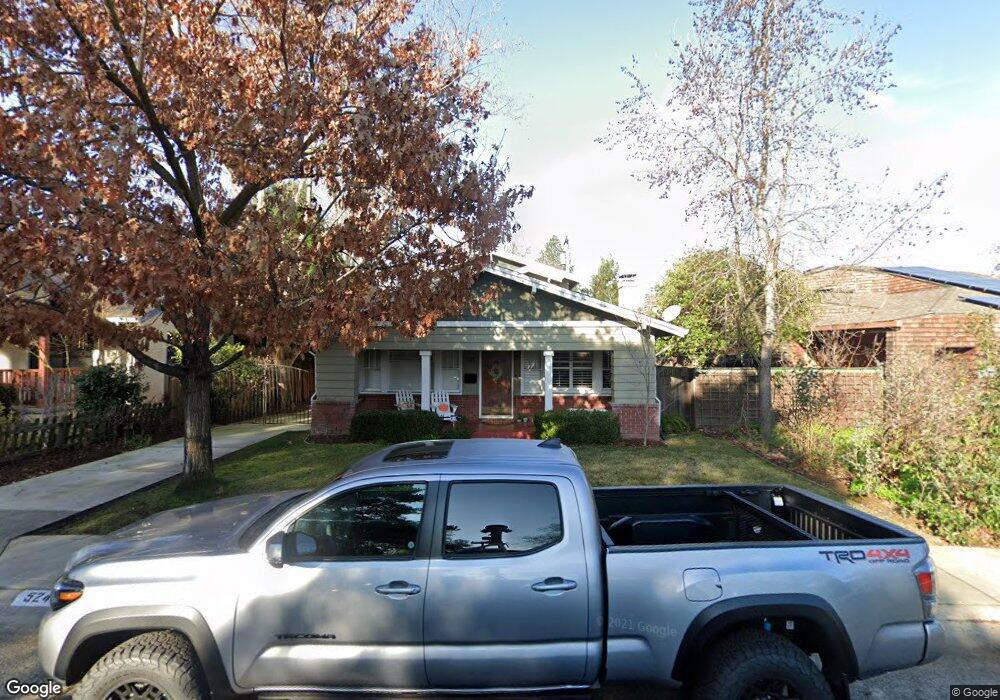
524 41st St Sacramento, CA 95819
East Sacramento NeighborhoodEstimated Value: $628,000 - $875,023
2
Beds
1
Bath
3,538
Sq Ft
$222/Sq Ft
Est. Value
About This Home
This home is located at 524 41st St, Sacramento, CA 95819 and is currently estimated at $783,756, approximately $221 per square foot. 524 41st St is a home located in Sacramento County with nearby schools including Theodore Judah Elementary, Miwok Middle School, and Hiram W. Johnson High School.
Ownership History
Date
Name
Owned For
Owner Type
Purchase Details
Closed on
Sep 22, 2009
Sold by
Carnahan Nathan and Carnahan Angela
Bought by
Carnahan Nathan J and Carnahan Angela L
Current Estimated Value
Home Financials for this Owner
Home Financials are based on the most recent Mortgage that was taken out on this home.
Original Mortgage
$463,248
Outstanding Balance
$303,885
Interest Rate
5.25%
Mortgage Type
New Conventional
Estimated Equity
$479,871
Purchase Details
Closed on
Sep 22, 2003
Sold by
Korte Gregory Mark and Craig Bentz N
Bought by
Carnahan Nathan and Carnahan Angela
Home Financials for this Owner
Home Financials are based on the most recent Mortgage that was taken out on this home.
Original Mortgage
$265,600
Interest Rate
6.17%
Mortgage Type
Purchase Money Mortgage
Purchase Details
Closed on
Nov 16, 1994
Sold by
Allen Francine and Williams Margaret T
Bought by
Korte Gregory Mark and Craig Bentz N
Create a Home Valuation Report for This Property
The Home Valuation Report is an in-depth analysis detailing your home's value as well as a comparison with similar homes in the area
Home Values in the Area
Average Home Value in this Area
Purchase History
| Date | Buyer | Sale Price | Title Company |
|---|---|---|---|
| Carnahan Nathan J | -- | Placer Title Company | |
| Carnahan Nathan | $332,000 | Stewart Title | |
| Korte Gregory Mark | $93,000 | American Title Insurance Co |
Source: Public Records
Mortgage History
| Date | Status | Borrower | Loan Amount |
|---|---|---|---|
| Open | Carnahan Nathan J | $463,248 | |
| Closed | Carnahan Nathan | $265,600 |
Source: Public Records
Tax History Compared to Growth
Tax History
| Year | Tax Paid | Tax Assessment Tax Assessment Total Assessment is a certain percentage of the fair market value that is determined by local assessors to be the total taxable value of land and additions on the property. | Land | Improvement |
|---|---|---|---|---|
| 2025 | $6,979 | $598,368 | $213,261 | $385,107 |
| 2024 | $6,979 | $586,636 | $209,080 | $377,556 |
| 2023 | $6,814 | $575,134 | $204,981 | $370,153 |
| 2022 | $6,699 | $563,858 | $200,962 | $362,896 |
| 2021 | $6,381 | $552,803 | $197,022 | $355,781 |
| 2020 | $6,434 | $547,135 | $195,002 | $352,133 |
| 2019 | $6,297 | $536,408 | $191,179 | $345,229 |
| 2018 | $6,132 | $525,891 | $187,431 | $338,460 |
| 2017 | $6,047 | $515,580 | $183,756 | $331,824 |
| 2016 | $5,897 | $505,471 | $180,153 | $325,318 |
| 2015 | $5,788 | $497,879 | $177,447 | $320,432 |
| 2014 | $5,629 | $488,128 | $173,972 | $314,156 |
Source: Public Records
Map
Nearby Homes