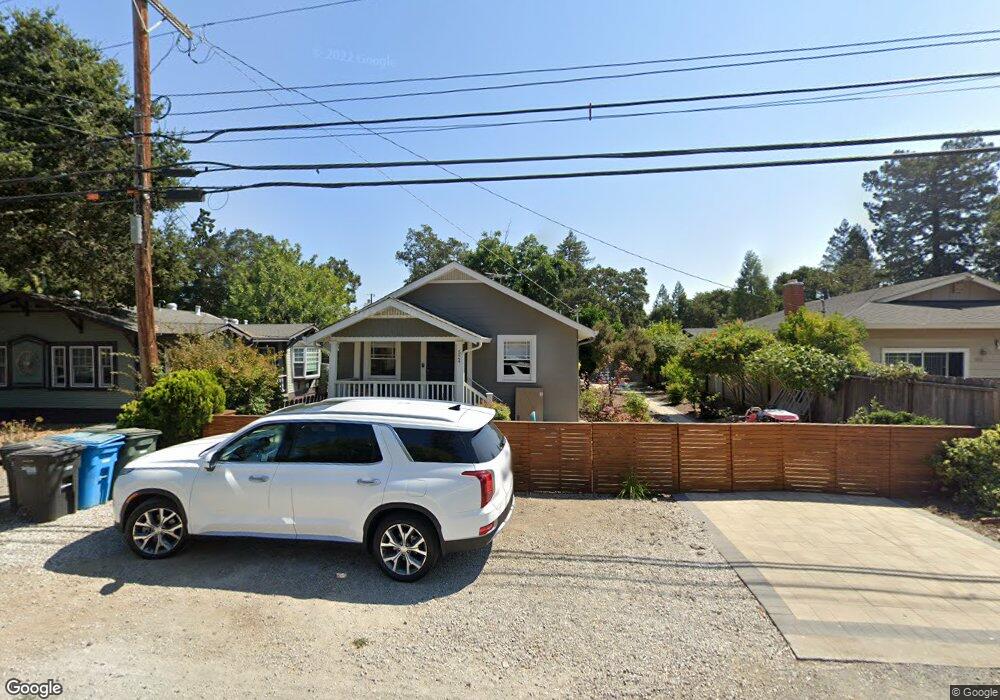
524 8th Ave Menlo Park, CA 94025
North Fair Oaks NeighborhoodEstimated Value: $1,785,000 - $2,221,000
3
Beds
2
Baths
1,310
Sq Ft
$1,464/Sq Ft
Est. Value
About This Home
This home is located at 524 8th Ave, Menlo Park, CA 94025 and is currently estimated at $1,918,083, approximately $1,464 per square foot. 524 8th Ave is a home located in San Mateo County with nearby schools including Garfield Elementary School, John F. Kennedy Middle School, and Menlo-Atherton High School.
Ownership History
Date
Name
Owned For
Owner Type
Purchase Details
Closed on
Oct 11, 2025
Sold by
Kanani Vishal Janak and Shah Beryl Suraj
Bought by
Shah Beryl Suraj
Current Estimated Value
Purchase Details
Closed on
Mar 15, 2019
Sold by
Batchelder William T and Batchelder Janice C
Bought by
Kanani Vishal Janak and Shah Beryl Suraj
Home Financials for this Owner
Home Financials are based on the most recent Mortgage that was taken out on this home.
Original Mortgage
$1,161,360
Interest Rate
3.62%
Mortgage Type
Adjustable Rate Mortgage/ARM
Create a Home Valuation Report for This Property
The Home Valuation Report is an in-depth analysis detailing your home's value as well as a comparison with similar homes in the area
Home Values in the Area
Average Home Value in this Area
Purchase History
| Date | Buyer | Sale Price | Title Company |
|---|---|---|---|
| Shah Beryl Suraj | -- | None Listed On Document | |
| Shah Beryl Suraj | -- | None Listed On Document | |
| Kanani Vishal Janak | $1,452,000 | Lawyers Title Company |
Source: Public Records
Mortgage History
| Date | Status | Borrower | Loan Amount |
|---|---|---|---|
| Previous Owner | Kanani Vishal Janak | $1,161,360 |
Source: Public Records
Tax History
| Year | Tax Paid | Tax Assessment Tax Assessment Total Assessment is a certain percentage of the fair market value that is determined by local assessors to be the total taxable value of land and additions on the property. | Land | Improvement |
|---|---|---|---|---|
| 2025 | $19,155 | $1,619,392 | $1,329,360 | $290,032 |
| 2023 | $19,155 | $1,556,512 | $1,277,741 | $278,771 |
| 2022 | $17,927 | $1,525,993 | $1,252,688 | $273,305 |
| 2021 | $17,736 | $1,496,073 | $1,228,126 | $267,947 |
| 2020 | $17,486 | $1,480,734 | $1,215,534 | $265,200 |
| 2019 | $2,999 | $147,980 | $121,807 | $26,173 |
| 2018 | $2,852 | $145,079 | $119,419 | $25,660 |
| 2017 | $2,646 | $142,235 | $117,078 | $25,157 |
| 2016 | $2,517 | $139,447 | $114,783 | $24,664 |
| 2015 | $2,421 | $137,353 | $113,059 | $24,294 |
| 2014 | $2,362 | $134,664 | $110,845 | $23,819 |
Source: Public Records
Map
Nearby Homes
Your Personal Tour Guide
Ask me questions while you tour the home.