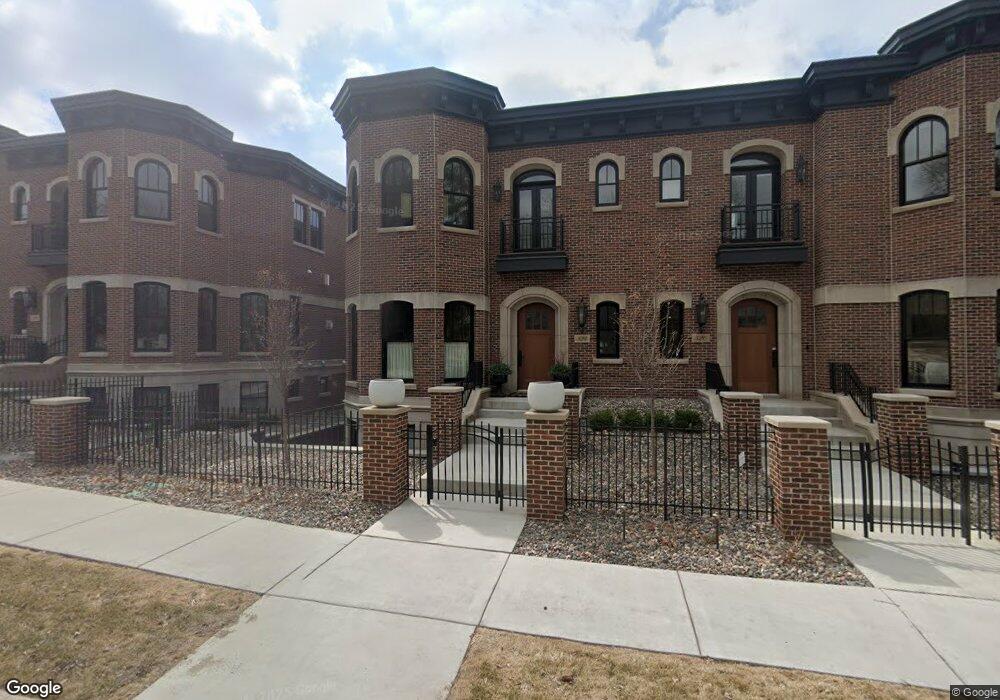
524 Rice St E Wayzata, MN 55391
Estimated Value: $2,373,000 - $2,786,325
3
Beds
4
Baths
2,726
Sq Ft
$954/Sq Ft
Est. Value
About This Home
This home is located at 524 Rice St E, Wayzata, MN 55391 and is currently estimated at $2,600,442, approximately $953 per square foot. 524 Rice St E is a home located in Hennepin County with nearby schools including Gleason Lake Elementary School, Wayzata West Middle School, and Wayzata High School.
Ownership History
Date
Name
Owned For
Owner Type
Purchase Details
Closed on
Jul 21, 2023
Sold by
Pillar Homes Partner Inc
Bought by
Sexson Paul and Sexson Julie
Current Estimated Value
Purchase Details
Closed on
Oct 21, 2020
Sold by
Chamberlin Capital Llc
Bought by
Pillar Homes Partner Inc
Home Financials for this Owner
Home Financials are based on the most recent Mortgage that was taken out on this home.
Original Mortgage
$1,150,000
Interest Rate
2.8%
Mortgage Type
Construction
Purchase Details
Closed on
Dec 13, 2011
Sold by
Berch Capital Llc
Bought by
Chamberlain Capital Llc
Purchase Details
Closed on
Nov 21, 2011
Sold by
Associated Bank National Association
Bought by
Berch Capital Llc
Purchase Details
Closed on
Sep 23, 2011
Sold by
Rice Street Brownstones Llc
Bought by
Associated Bank National Association
Create a Home Valuation Report for This Property
The Home Valuation Report is an in-depth analysis detailing your home's value as well as a comparison with similar homes in the area
Home Values in the Area
Average Home Value in this Area
Purchase History
| Date | Buyer | Sale Price | Title Company |
|---|---|---|---|
| Sexson Paul | $2,877,006 | -- | |
| Pillar Homes Partner Inc | $1,100,100 | Custom Home Builders Ttl Llc | |
| Chamberlain Capital Llc | $370,000 | Titlenexus Llc | |
| Berch Capital Llc | $250,000 | Edina Realty Title Inc | |
| Associated Bank National Association | -- | None Available |
Source: Public Records
Mortgage History
| Date | Status | Borrower | Loan Amount |
|---|---|---|---|
| Previous Owner | Pillar Homes Partner Inc | $1,150,000 |
Source: Public Records
Tax History
| Year | Tax Paid | Tax Assessment Tax Assessment Total Assessment is a certain percentage of the fair market value that is determined by local assessors to be the total taxable value of land and additions on the property. | Land | Improvement |
|---|---|---|---|---|
| 2024 | $27,187 | $2,210,800 | $1,104,000 | $1,106,800 |
| 2023 | $17,229 | $1,488,900 | $1,168,000 | $320,900 |
| 2022 | $2,386 | $167,000 | $167,000 | $0 |
| 2021 | $2,257 | $167,000 | $167,000 | $0 |
| 2020 | $2,210 | $159,000 | $159,000 | $0 |
| 2019 | $2,010 | $150,000 | $150,000 | $0 |
| 2018 | $2,047 | $136,000 | $136,000 | $0 |
| 2017 | $1,731 | $114,000 | $114,000 | $0 |
| 2016 | $1,631 | $104,000 | $104,000 | $0 |
| 2015 | $1,597 | $99,000 | $99,000 | $0 |
| 2014 | -- | $92,000 | $92,000 | $0 |
Source: Public Records
Map
Nearby Homes
- 540 Rice St E
- 132 Minnetonka Ave N
- 150 Broadway Ave S Unit 2B
- 150 Broadway Ave S Unit 2A
- 150 Broadway Ave S Unit 3C
- 150 Broadway Ave S Unit 3D
- 296 Grace Pointe Ct
- 373 Park St E
- 724 Widsten Cir
- 633 Park St E
- 641 Park St E
- 205 Barry Ave S Unit 114
- 638 Gardner St
- 129 Chicago Ave N
- 222 Ferndale Rd S Unit 103
- 222 Ferndale Rd S Unit 203
- 222 Ferndale Rd S Unit 105
- 103 Edgewood Ct
- 875 Lake St N Unit 216
- 875 Lake St N Unit 318
- 520 Rice St E
- 530 Rice St E
- 534 Rice St E
- 216 Minnetonka Ave S
- 206 Minnetonka Ave S
- 207 Walker Ave S
- 216 216 Minnetonka Ave S
- 544 Rice St E
- 209 Walker Ave S
- 523 Rice St E
- 517 Rice St E
- 527 Rice St E
- 211 Walker Ave S
- 215 Walker Ave S
- 507 Rice St E
- 125 Walker Ave S
- 545 Indian Mound St E Unit 2
- 240 Minnetonka Ave S Unit 401
- 240 Minnetonka Ave S Unit 201
- 240 Minnetonka Ave S Unit 304
Your Personal Tour Guide
Ask me questions while you tour the home.