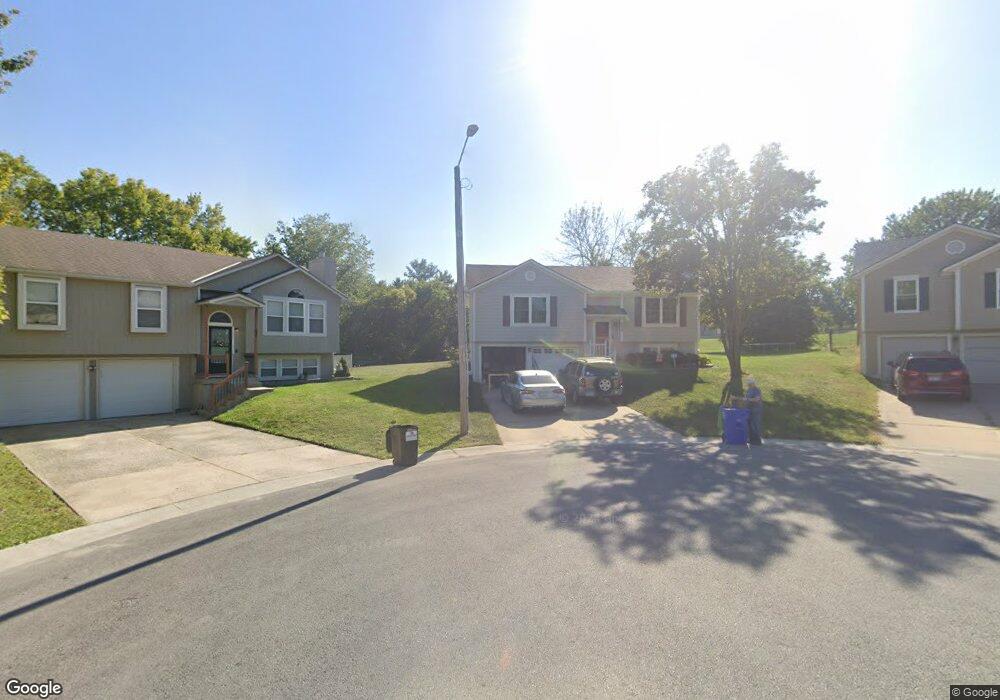
524 SE Onyx Dr Lees Summit, MO 64063
Estimated Value: $269,839 - $290,000
3
Beds
2
Baths
953
Sq Ft
$291/Sq Ft
Est. Value
About This Home
This home is located at 524 SE Onyx Dr, Lees Summit, MO 64063 and is currently estimated at $277,460, approximately $291 per square foot. 524 SE Onyx Dr is a home located in Jackson County with nearby schools including Pleasant Lea Middle School and Lee's Summit Senior High School.
Ownership History
Date
Name
Owned For
Owner Type
Purchase Details
Closed on
Feb 6, 2007
Sold by
Jeffrey Bradley W and Jeffrey Carolyn E
Bought by
Jeffrey Bradley W and Jeffrey Carolyn E
Current Estimated Value
Purchase Details
Closed on
Feb 11, 2002
Sold by
Kellett Alana L
Bought by
Jeffrey Bradley W and Jeffrey Carolyn E
Home Financials for this Owner
Home Financials are based on the most recent Mortgage that was taken out on this home.
Original Mortgage
$114,000
Outstanding Balance
$47,338
Interest Rate
7.12%
Mortgage Type
Purchase Money Mortgage
Estimated Equity
$230,123
Purchase Details
Closed on
Jun 1, 1998
Sold by
Renaut Paula S
Bought by
Kellett Alana L
Home Financials for this Owner
Home Financials are based on the most recent Mortgage that was taken out on this home.
Original Mortgage
$85,746
Interest Rate
7.22%
Mortgage Type
FHA
Create a Home Valuation Report for This Property
The Home Valuation Report is an in-depth analysis detailing your home's value as well as a comparison with similar homes in the area
Home Values in the Area
Average Home Value in this Area
Purchase History
| Date | Buyer | Sale Price | Title Company |
|---|---|---|---|
| Jeffrey Bradley W | -- | None Available | |
| Jeffrey Bradley W | -- | Security Land Title Co | |
| Kellett Alana L | -- | Coffelt Land Title Inc |
Source: Public Records
Mortgage History
| Date | Status | Borrower | Loan Amount |
|---|---|---|---|
| Open | Jeffrey Bradley W | $114,000 | |
| Previous Owner | Kellett Alana L | $85,746 |
Source: Public Records
Tax History Compared to Growth
Tax History
| Year | Tax Paid | Tax Assessment Tax Assessment Total Assessment is a certain percentage of the fair market value that is determined by local assessors to be the total taxable value of land and additions on the property. | Land | Improvement |
|---|---|---|---|---|
| 2025 | $2,357 | $37,541 | $7,268 | $30,273 |
| 2024 | $2,340 | $32,644 | $7,304 | $25,340 |
| 2023 | $2,340 | $32,644 | $5,449 | $27,195 |
| 2022 | $2,347 | $29,070 | $3,766 | $25,304 |
| 2021 | $2,395 | $29,070 | $3,766 | $25,304 |
| 2020 | $2,296 | $27,591 | $3,766 | $23,825 |
| 2019 | $2,233 | $27,591 | $3,766 | $23,825 |
| 2018 | $2,094 | $24,013 | $3,278 | $20,735 |
| 2017 | $2,063 | $24,013 | $3,278 | $20,735 |
| 2016 | $2,063 | $23,411 | $3,895 | $19,516 |
| 2014 | $2,063 | $22,952 | $3,819 | $19,133 |
Source: Public Records
Map
Nearby Homes
- 2123 SE 5th St
- 413 SE Topaz Dr
- 436 SE Ashton Dr
- 428 SE Ashton Dr
- 2112 SE 3rd St
- 2316 SE 6th St
- 1724 SE 5th Terrace
- 258 SE Topaz Cir
- 208 SE Keystone Dr
- 2403 SE 5th Terrace
- 503 SE Brownfield Dr
- 1819 SE 3rd St
- 1802 SE 3rd Terrace
- 424 SE Nathan Pass
- 1639 SE Boone Trail
- 510 SE Greenridge Dr
- 2433 SE 6th St
- 201 SE Somerset Dr
- 608 SE Greenridge Dr
- 107 NE Greystone Dr Unit 59
- 525 SE Onyx Dr
- 520 SE Onyx Dr
- 516 SE Onyx Dr
- 512 SE Onyx Dr
- 517 SE Onyx Dr
- 508 SE Onyx Dr
- 513 SE Onyx Dr
- 612 SE Ashton Dr
- 604 SE Ashton Dr
- 616 SE Ashton Dr
- 600 SE Ashton Dr
- 544 SE Ashton Dr
- 504 SE Onyx Dr
- 620 SE Ashton Dr
- 540 SE Ashton Dr
- 505 SE Onyx Dr
- 613 SE Ashton Dr
- 609 SE Ashton Dr
- 500 SE Onyx Dr
- 536 SE Ashton Dr