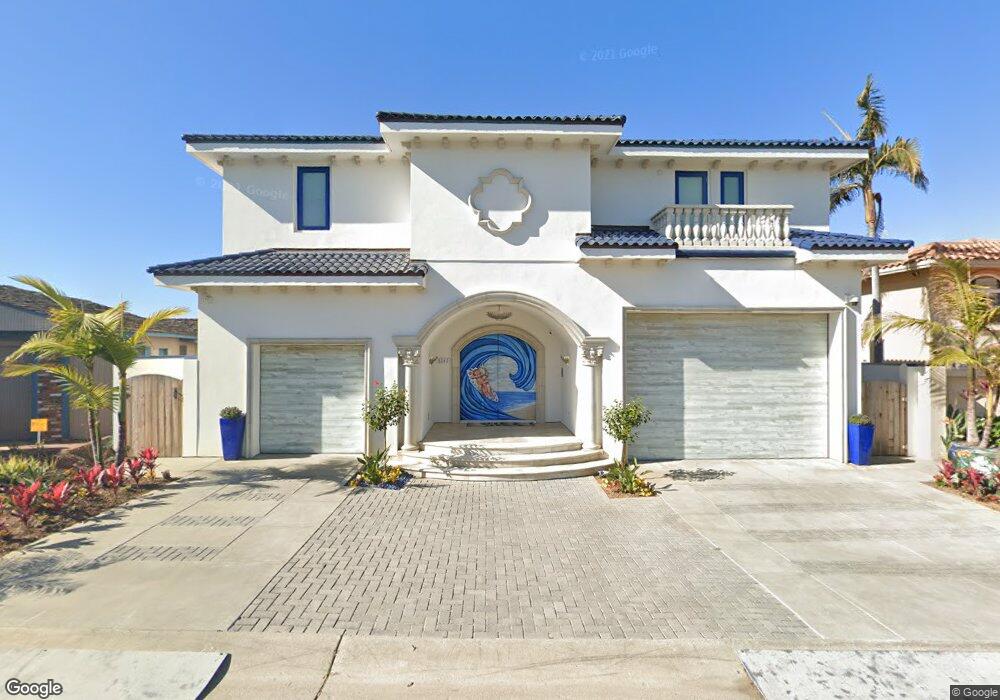
5243 Shore Dr Carlsbad, CA 92008
South Beach NeighborhoodEstimated Value: $5,751,846 - $6,402,000
5
Beds
6
Baths
6,597
Sq Ft
$929/Sq Ft
Est. Value
About This Home
This home is located at 5243 Shore Dr, Carlsbad, CA 92008 and is currently estimated at $6,130,949, approximately $929 per square foot. 5243 Shore Dr is a home located in San Diego County with nearby schools including Carlsbad High School, Sage Creek High, and St. Patrick Catholic School.
Ownership History
Date
Name
Owned For
Owner Type
Purchase Details
Closed on
Dec 14, 2004
Sold by
Pryor Jeffrey Wayne
Bought by
Pryor Jeffrey W
Current Estimated Value
Purchase Details
Closed on
Jan 16, 2002
Sold by
Pryor Jeffery W
Bought by
Pryor Jeffery Wayne
Home Financials for this Owner
Home Financials are based on the most recent Mortgage that was taken out on this home.
Original Mortgage
$1,755,000
Outstanding Balance
$670,083
Interest Rate
6.12%
Estimated Equity
$5,460,866
Purchase Details
Closed on
Jul 12, 1999
Sold by
Rc Vc Trust 03-27-92 and Edward Reid
Bought by
Pryor Jeffery W
Home Financials for this Owner
Home Financials are based on the most recent Mortgage that was taken out on this home.
Original Mortgage
$1,100,000
Interest Rate
2.95%
Create a Home Valuation Report for This Property
The Home Valuation Report is an in-depth analysis detailing your home's value as well as a comparison with similar homes in the area
Home Values in the Area
Average Home Value in this Area
Purchase History
| Date | Buyer | Sale Price | Title Company |
|---|---|---|---|
| Pryor Jeffrey W | -- | -- | |
| Pryor Jeffery Wayne | -- | Commonwealth Land Title Co | |
| Pryor Jeffery W | -- | Commonwealth Land Title Co |
Source: Public Records
Mortgage History
| Date | Status | Borrower | Loan Amount |
|---|---|---|---|
| Open | Pryor Jeffery Wayne | $1,755,000 | |
| Closed | Pryor Jeffery W | $1,100,000 |
Source: Public Records
Tax History Compared to Growth
Tax History
| Year | Tax Paid | Tax Assessment Tax Assessment Total Assessment is a certain percentage of the fair market value that is determined by local assessors to be the total taxable value of land and additions on the property. | Land | Improvement |
|---|---|---|---|---|
| 2025 | $38,084 | $3,646,788 | $2,151,776 | $1,495,012 |
| 2024 | $38,084 | $3,575,284 | $2,109,585 | $1,465,699 |
| 2023 | $37,895 | $3,505,181 | $2,068,221 | $1,436,960 |
| 2022 | $37,311 | $3,436,453 | $2,027,668 | $1,408,785 |
| 2021 | $37,030 | $3,369,072 | $1,987,910 | $1,381,162 |
| 2020 | $36,781 | $3,334,527 | $1,967,527 | $1,367,000 |
| 2019 | $32,280 | $2,921,107 | $1,928,949 | $992,158 |
| 2018 | $26,986 | $2,499,047 | $1,891,127 | $607,920 |
| 2017 | $26,539 | $2,450,047 | $1,854,047 | $596,000 |
| 2016 | $19,197 | $1,817,694 | $1,817,694 | $0 |
| 2015 | $22,222 | $2,078,126 | $1,790,391 | $287,735 |
| 2014 | $21,847 | $2,037,419 | $1,755,320 | $282,099 |
Source: Public Records
Map
Nearby Homes
- 5143 Shore Dr
- 5301 Los Robles Dr
- 5170 Carlsbad Blvd
- 5390 Carlsbad Blvd
- 5380 Los Robles Dr
- 5183 El Arbol Dr
- 6536 Oceanview Dr Unit T
- 6508 Easy St Unit T
- 6508 Friendly Place
- 6494 Friendly Place
- 6503 Friendly Place
- 0 Adams St Unit OC24201399
- 817 Kalpati Cir Unit 212
- 823 Kalpati Cir Unit 101
- 393 Date Ave
- 4015 Canario St Unit E
- 4015 Canario St Unit D
- 4777 Beachwood Ct
- 4380 Adams St
- 801 Kalpati Cir Unit B
- 5229 Shore Dr
- 5257 Shore Dr
- 5215 Shore Dr
- 5236 Shore Dr
- 5263 Shore Dr
- 5226 Shore Dr
- 5273 Shore Dr
- 5201 Shore Dr
- 5208 Shore Dr
- 5283 Shore Dr
- 5262 Shore Dr
- 5195 Shore Dr
- 5225 Carlsbad Blvd
- 5198 Shore Dr
- 5285 Shore Dr Unit ID1248655P
- 5285 Shore Dr
- 5185 Shore Dr Unit ID1248675P
- 5185 Shore Dr
- 5195 Carlsbad Blvd Unit 97
- 5190 Shore Dr