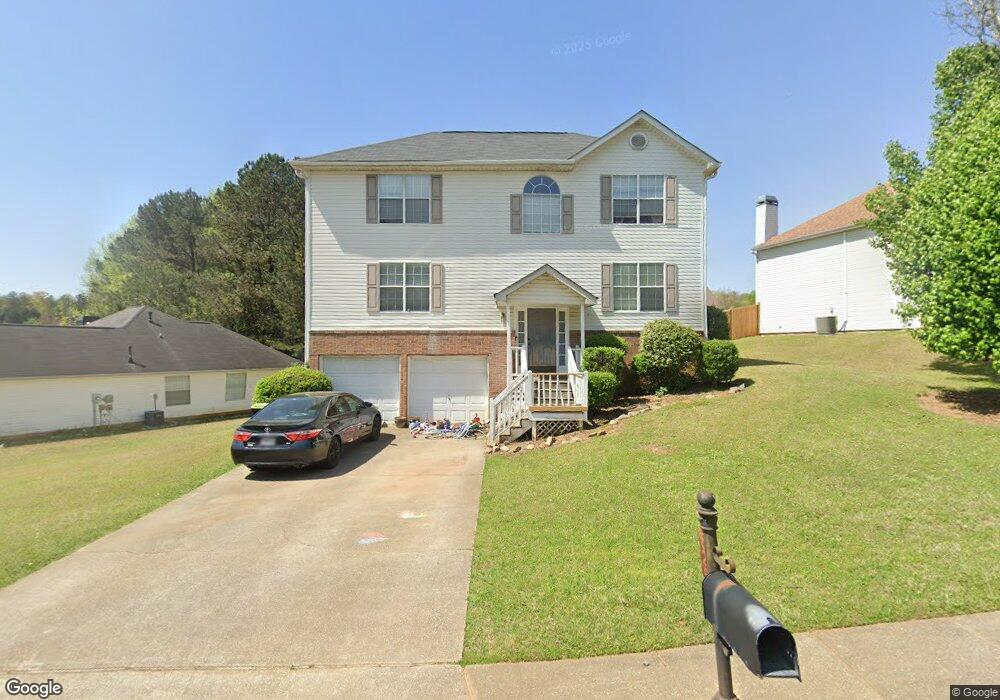
525 Brookstone Way Stockbridge, GA 30281
Estimated Value: $255,000 - $304,000
3
Beds
3
Baths
1,861
Sq Ft
$149/Sq Ft
Est. Value
About This Home
This home is located at 525 Brookstone Way, Stockbridge, GA 30281 and is currently estimated at $277,467, approximately $149 per square foot. 525 Brookstone Way is a home located in Henry County with nearby schools including Red Oak Elementary School, Dutchtown Middle School, and Dutchtown High School.
Ownership History
Date
Name
Owned For
Owner Type
Purchase Details
Closed on
Jun 18, 2007
Sold by
S Bank National Association
Bought by
Lee Latasha
Current Estimated Value
Home Financials for this Owner
Home Financials are based on the most recent Mortgage that was taken out on this home.
Original Mortgage
$120,000
Outstanding Balance
$73,069
Interest Rate
6.1%
Mortgage Type
New Conventional
Estimated Equity
$204,398
Purchase Details
Closed on
Jan 2, 2007
Sold by
Jones Demetrius
Bought by
Home Equity Asset Trust 2005-6
Purchase Details
Closed on
Feb 9, 2005
Sold by
Greenhow Karen N
Bought by
Jones Demerius
Home Financials for this Owner
Home Financials are based on the most recent Mortgage that was taken out on this home.
Original Mortgage
$117,200
Interest Rate
5.6%
Mortgage Type
New Conventional
Purchase Details
Closed on
Oct 22, 1996
Sold by
Jonesinc Herman
Bought by
Greenhow Karen
Create a Home Valuation Report for This Property
The Home Valuation Report is an in-depth analysis detailing your home's value as well as a comparison with similar homes in the area
Home Values in the Area
Average Home Value in this Area
Purchase History
| Date | Buyer | Sale Price | Title Company |
|---|---|---|---|
| Lee Latasha | $120,000 | -- | |
| Home Equity Asset Trust 2005-6 | $114,749 | -- | |
| Jones Demerius | $146,600 | -- | |
| Greenhow Karen | $129,900 | -- |
Source: Public Records
Mortgage History
| Date | Status | Borrower | Loan Amount |
|---|---|---|---|
| Open | Lee Latasha | $120,000 | |
| Previous Owner | Jones Demerius | $117,200 | |
| Closed | Greenhow Karen | $0 |
Source: Public Records
Tax History Compared to Growth
Tax History
| Year | Tax Paid | Tax Assessment Tax Assessment Total Assessment is a certain percentage of the fair market value that is determined by local assessors to be the total taxable value of land and additions on the property. | Land | Improvement |
|---|---|---|---|---|
| 2025 | $3,499 | $106,256 | $14,000 | $92,256 |
| 2024 | $3,499 | $106,800 | $14,000 | $92,800 |
| 2023 | $3,173 | $108,400 | $10,000 | $98,400 |
| 2022 | $2,683 | $87,680 | $10,000 | $77,680 |
| 2021 | $2,217 | $67,960 | $8,000 | $59,960 |
| 2020 | $2,080 | $62,160 | $8,000 | $54,160 |
| 2019 | $1,964 | $57,280 | $8,000 | $49,280 |
| 2018 | $1,858 | $53,680 | $8,000 | $45,680 |
| 2016 | $1,648 | $48,200 | $8,000 | $40,200 |
| 2015 | $1,438 | $41,880 | $7,600 | $34,280 |
| 2014 | $1,171 | $34,880 | $4,800 | $30,080 |
Source: Public Records
Map
Nearby Homes
- 213 Baron Ct
- 318 Eagle Ct
- 9 Cheyenne Dr
- 184 Eagle Way
- 235 Alexis Ave
- 564 Goldfinch Way
- 537 Goldfinch Way
- 816 Lorraine Ln Unit 4
- 377 Avian Forest Dr
- 396 Avian Forest Dr
- 32 Bay Cove Dr
- 44 Bay Cove Dr
- 137 Dustin Dr
- 486 Village Cir
- 469 Village Cir
- 503 Goldfinch Way
- 843 Tramore Dr
- 0 Tye St Unit 10634748
- 0 Tye St Unit 20124844
- 600 Dairy Dr
- 519 Brookstone Way
- 531 Brookstone Way
- 0 Brookstone Way Unit 7014744
- 252 Eagle Way Unit 4
- 513 Brookstone Way
- 513 Brookstone Way Unit IV
- 528 Brookstone Way
- 524 Brookstone Way Unit IV
- 264 Eagle Way
- 520 Brookstone Way
- 520 Brookstone Way Unit 4
- 248 Eagle Way Unit 4
- 516 Brookstone Way
- 512 Brookstone Way
- 512 Brookstone Way Unit IV
- 507 Brookstone Way
- 413 Trinkle Ct
- 413 Trinkle Ct Unit IV
- 251 Eagle Way
- 255 Eagle Way