527 E Oak Ave El Segundo, CA 90245
Estimated Value: $1,465,000 - $2,875,000
6
Beds
6
Baths
4,574
Sq Ft
$498/Sq Ft
Est. Value
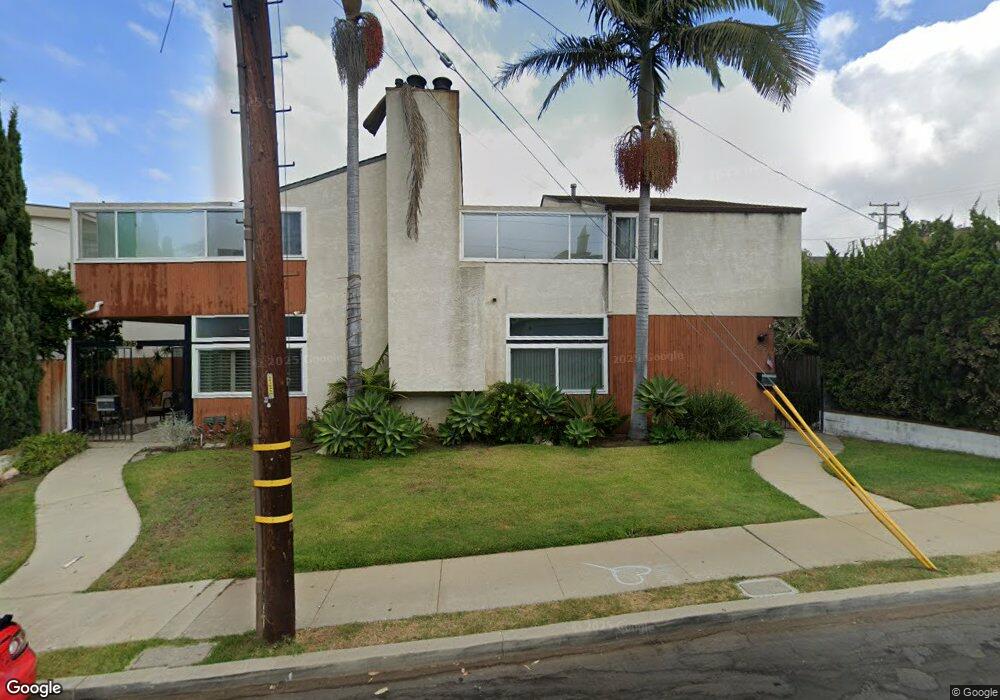
About This Home
This home is located at 527 E Oak Ave, El Segundo, CA 90245 and is currently estimated at $2,278,390, approximately $498 per square foot. 527 E Oak Ave is a home located in Los Angeles County with nearby schools including Center Street Elementary, El Segundo Middle School, and El Segundo High School.
Ownership History
Date
Name
Owned For
Owner Type
Purchase Details
Closed on
Sep 21, 1998
Sold by
Rock Elaine
Bought by
Rock Elaine and Elaine Rock Trust
Current Estimated Value
Home Financials for this Owner
Home Financials are based on the most recent Mortgage that was taken out on this home.
Original Mortgage
$290,650
Interest Rate
6.88%
Purchase Details
Closed on
Sep 17, 1998
Sold by
Magraudy Nancy
Bought by
Rock Elaine and Magraudy Nancy
Home Financials for this Owner
Home Financials are based on the most recent Mortgage that was taken out on this home.
Original Mortgage
$290,650
Interest Rate
6.88%
Purchase Details
Closed on
Aug 8, 1998
Sold by
Magraudy Nancy Tr
Bought by
Rock Elaine and Magraudy Nancy
Home Financials for this Owner
Home Financials are based on the most recent Mortgage that was taken out on this home.
Original Mortgage
$290,650
Interest Rate
6.88%
Create a Home Valuation Report for This Property
The Home Valuation Report is an in-depth analysis detailing your home's value as well as a comparison with similar homes in the area
Home Values in the Area
Average Home Value in this Area
Purchase History
| Date | Buyer | Sale Price | Title Company |
|---|---|---|---|
| Rock Elaine | -- | -- | |
| Rock Elaine | -- | -- | |
| Rock Elaine | -- | Chicago Title |
Source: Public Records
Mortgage History
| Date | Status | Borrower | Loan Amount |
|---|---|---|---|
| Closed | Rock Elaine | $290,650 |
Source: Public Records
Tax History
| Year | Tax Paid | Tax Assessment Tax Assessment Total Assessment is a certain percentage of the fair market value that is determined by local assessors to be the total taxable value of land and additions on the property. | Land | Improvement |
|---|---|---|---|---|
| 2025 | $7,913 | $697,365 | $327,546 | $369,819 |
| 2024 | $7,913 | $683,692 | $321,124 | $362,568 |
| 2023 | $7,712 | $670,287 | $314,828 | $355,459 |
| 2022 | $7,787 | $657,145 | $308,655 | $348,490 |
| 2021 | $7,654 | $644,260 | $302,603 | $341,657 |
| 2019 | $7,395 | $625,153 | $293,629 | $331,524 |
| 2018 | $6,873 | $612,896 | $287,872 | $325,024 |
| 2016 | $6,625 | $589,098 | $276,695 | $312,403 |
| 2015 | $6,542 | $580,250 | $272,539 | $307,711 |
| 2014 | $6,411 | $568,885 | $267,201 | $301,684 |
Source: Public Records
Map
Nearby Homes
- 519 E Sycamore Ave
- 329 E Maple Ave
- 529 E Walnut Ave
- 529 Sierra Place
- 572 E Imperial Ave
- 825 Center St
- 860 Bungalow Dr
- 426 E Imperial Ave
- 432 Lomita St
- 906 E Imperial Ave
- 211 E Pine Ave
- 745 Main St
- 121 E Walnut Ave
- 212 E Imperial Ave Unit A
- 212 E Imperial Ave Unit E
- 924 Main St
- 935 Main St Unit 303
- 1112 E Imperial Ave
- 1116 E Imperial Ave
- 412 Richmond St
Your Personal Tour Guide
Ask me questions while you tour the home.