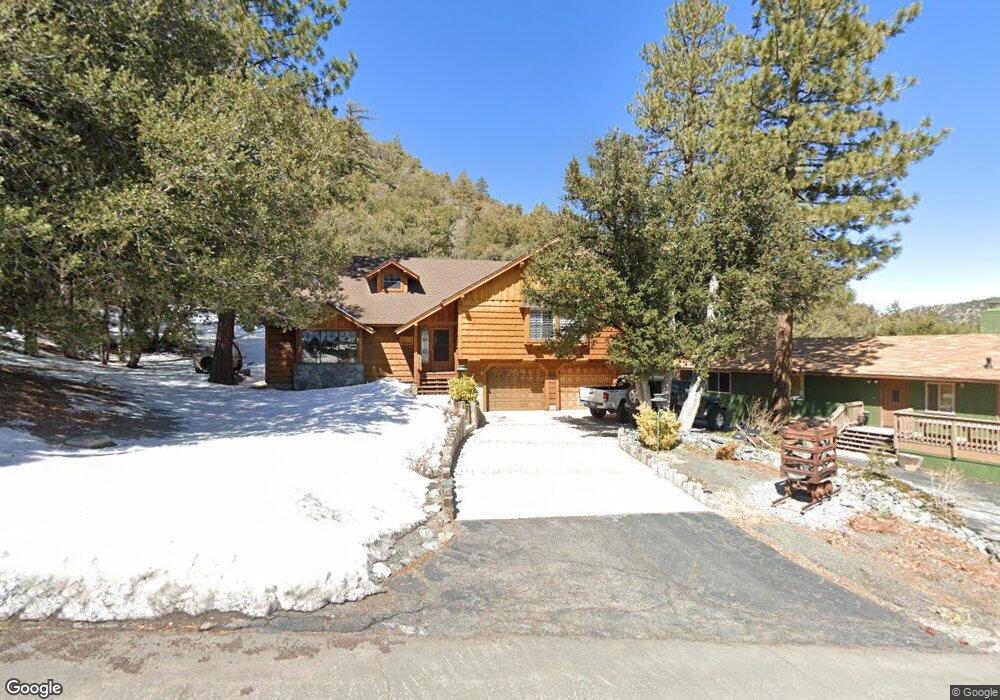
5278 Desert View Ln Wrightwood, CA 92397
Estimated Value: $542,000 - $810,000
3
Beds
3
Baths
2,250
Sq Ft
$286/Sq Ft
Est. Value
About This Home
This home is located at 5278 Desert View Ln, Wrightwood, CA 92397 and is currently estimated at $643,079, approximately $285 per square foot. 5278 Desert View Ln is a home with nearby schools including Wrightwood Elementary School, Pinon Mesa Middle School, and Serrano High School.
Ownership History
Date
Name
Owned For
Owner Type
Purchase Details
Closed on
May 12, 2006
Sold by
Bisson Kenneth P
Bought by
Bisson Kenneth P and Bisson Sheryl
Current Estimated Value
Home Financials for this Owner
Home Financials are based on the most recent Mortgage that was taken out on this home.
Original Mortgage
$60,000
Outstanding Balance
$34,769
Interest Rate
6.41%
Mortgage Type
Credit Line Revolving
Estimated Equity
$608,310
Purchase Details
Closed on
May 8, 2006
Sold by
Bisson Sheryl
Bought by
Bisson Kenneth P
Home Financials for this Owner
Home Financials are based on the most recent Mortgage that was taken out on this home.
Original Mortgage
$60,000
Outstanding Balance
$34,769
Interest Rate
6.41%
Mortgage Type
Credit Line Revolving
Estimated Equity
$608,310
Purchase Details
Closed on
Nov 24, 1993
Sold by
Bisson Kenneth P
Bought by
Bisson Kenneth P
Home Financials for this Owner
Home Financials are based on the most recent Mortgage that was taken out on this home.
Original Mortgage
$137,500
Interest Rate
7.09%
Create a Home Valuation Report for This Property
The Home Valuation Report is an in-depth analysis detailing your home's value as well as a comparison with similar homes in the area
Home Values in the Area
Average Home Value in this Area
Purchase History
| Date | Buyer | Sale Price | Title Company |
|---|---|---|---|
| Bisson Kenneth P | -- | Ticor Title Company | |
| Bisson Kenneth P | -- | Ticor Title Company | |
| Bisson Kenneth P | -- | Union Land Title Company |
Source: Public Records
Mortgage History
| Date | Status | Borrower | Loan Amount |
|---|---|---|---|
| Open | Bisson Kenneth P | $60,000 | |
| Closed | Bisson Kenneth P | $137,500 |
Source: Public Records
Tax History
| Year | Tax Paid | Tax Assessment Tax Assessment Total Assessment is a certain percentage of the fair market value that is determined by local assessors to be the total taxable value of land and additions on the property. | Land | Improvement |
|---|---|---|---|---|
| 2025 | $4,665 | $416,778 | $48,810 | $367,968 |
| 2024 | $4,349 | $408,606 | $47,853 | $360,753 |
| 2023 | $4,299 | $400,594 | $46,915 | $353,679 |
| 2022 | $4,197 | $392,739 | $45,995 | $346,744 |
| 2021 | $4,118 | $385,038 | $45,093 | $339,945 |
| 2020 | $4,065 | $381,090 | $44,631 | $336,459 |
| 2019 | $3,983 | $373,618 | $43,756 | $329,862 |
| 2018 | $3,751 | $366,292 | $42,898 | $323,394 |
| 2017 | $3,684 | $359,110 | $42,057 | $317,053 |
| 2016 | $3,603 | $352,068 | $41,232 | $310,836 |
| 2015 | $3,557 | $346,780 | $40,613 | $306,167 |
| 2014 | $3,408 | $330,100 | $98,900 | $231,200 |
Source: Public Records
Map
Nearby Homes
- 5203 Desert View Dr
- 999 Buckthorn Rd
- 2068 Slippery Elm Rd
- 5335 Desert View Ct
- 2080 Mojave Scenic Dr
- 5412 Heath Creek Dr
- 5291 Orchard Dr
- 5464 Lone Pine Canyon Rd
- 6201 Lone Pine Canyon Rd
- 5328 Shirley J Ln
- 1764 Ash Rd
- 1792 Ash Rd
- 5495 Summit Dr
- 5608 Sheep Creek Dr
- 0 Heath Creek Dr
- 2329 E Canyon Dr
- 0 Lodgepole Dr Unit OC25149079
- 2046 Thrush Rd
- 5595 Sycamore St
- 0 Blackbird Unit HD25012488
- 5280 Desert View Ln
- 0 Desert View Ln
- 5284 Desert View Dr
- 5270 Desert View Ln
- 5288 Desert View Dr
- 5244 Desert View Dr
- 5248 Desert View Ln
- 5268 Desert View Ln
- 5252 Desert View Ln
- 5243 Desert View Dr
- 5283 Desert View Dr
- 5279 Desert View Dr
- 5240 Desert Front Rd
- 5240 Desert View Dr
- 5254 Desert View Ln Unit 1
- 5233 Desert View Dr
- 5264 Desert View Ln
- 5295 Desert View Dr
- 5236 Desert View Dr
Your Personal Tour Guide
Ask me questions while you tour the home.